More Information
Submitted: January 06, 2025 | Approved: January 11, 2025 | Published: January 16, 2025
How to cite this article: Anwer HA, Hassan A, Anwer G. Satellite-Based Analysis of Air Pollution Trends in Khartoum before and After the Conflict. Ann Civil Environ Eng. 2025; 9(1): 001-011. Available from:
https://dx.doi.org/10.29328/journal.acee.1001074
DOI: 10.29328/journal.acee.1001074
Copyright License: © 2025 Anwer HA, et al. This is an open access article distributed under the Creative Commons Attribution License, which permits unrestricted use, distribution, and reproduction in any medium, provided the original work is properly cited.
Keywords: Air pollution; Environmental impact of war; Satellite remote sensing; Google Earth Engine (GEE); Sentinel-5P
Satellite-Based Analysis of Air Pollution Trends in Khartoum before and After the Conflict
Hossam Aldeen Anwer1*, Abubakr Hassan1 and Ghofran Anwer2
1Department of Surveying Engineering, Karary University, Sudan
2Faculty of Public and Environmental Health, University of Khartoum, Sudan
*Address for Correspondence: Hossam Aldeen Anwer, Department of Surveying Engineering, Karary University, Sudan, Email: [email protected]
This study investigates the impact of socio-political disruptions on air quality in Khartoum, Sudan, focusing on key pollutants: Aerosol Optical Depth (AOD), Carbon Monoxide (CO), Nitrogen Dioxide (NO2), and Sulfur Dioxide (SO2). Using Sentinel-5P satellite data (2020–2024) processed in Google Earth Engine (GEE), spatial and temporal variations in pollutant levels were analyzed before and after a significant war event in April 2023. The methodology included data acquisition, preprocessing (e.g., cloud masking, spatial filtering), monthly averages computation, visualization, and statistical analysis using Google Earth Engine (GEE), ArcGIS Pro, and Microsoft Excel. Results showed a marked post-war increase in AOD levels, attributed to infrastructure destruction, fires, and diminished industrial oversight, alongside spatially consistent pollution patterns in some regions. CO concentrations exhibited an overall decline due to reduced industrial activities and transportation, though localized anomalies were linked to concentrated emissions. Similarly, NO2 levels dropped significantly, reflecting reduced vehicular and industrial activities, while sporadic increases suggested localized emissions like generator use. SO2 demonstrated mixed trends, with reduced mean levels but increased variability, indicating sporadic high-emission events linked to emergency fuel use or conflict-related disruptions. This study uniquely combines high-resolution satellite data with advanced spatial and temporal analysis techniques to reveal the nuanced and multi-pollutant impact of socio-political conflicts on air quality in Khartoum, providing novel insights into the environmental repercussions of armed conflicts. These findings highlight the profound impact of socio-political events on atmospheric pollution dynamics, underscoring the need for robust urban planning, targeted environmental monitoring, and policies to mitigate air quality deterioration and address public health concerns in conflict-prone regions. The study emphasizes the importance of satellite-based monitoring to provide critical insights into the environmental repercussions of socio-political upheavals.
Armed conflicts have profound effects on air quality as shown in Figure 1, stemming from both direct and indirect sources of atmospheric pollution. Military activities, including explosions and the destruction of infrastructure, release substantial quantities of pollutants such as Particulate Matter (PM2.5, PM10), Nitrogen Dioxide (NO2), Sulfur Dioxide (SO2), Aerosol Optical Depth (AOD), and Carbon Monoxide (CO). These emissions are linked to significant health issues, particularly respiratory and cardiovascular conditions, disproportionately affecting vulnerable groups like children, the elderly, and those with preexisting health challenges.
Figure 1: Effect of Conflict on Air Pollution.
For instance, during the early stages of the Russia-Ukraine conflict, satellite observations indicated a marked reduction in NO2 and SO2 levels due to decreased industrial operations and transportation. However, concurrent military activities, such as bombings and wildfires, caused sharp increases in Aerosol Optical Depth (AOD) and toxic gases, leading to substantial regional air quality disruptions. These trends underscore the intricate interactions between human-induced emissions, military operations, and natural disasters triggered by conflicts [1,2].
The impact of war on air quality and pollutants such as NO2, SO2, CO, and Aerosol Optical Depth (AOD) is substantial, with far-reaching effects on both human health and the environment. Conflicts often lead to heightened emissions of harmful pollutants due to intensified combustion, destruction of infrastructure, and diminished regulatory control.
Nitrogen Dioxide (NO2)
Wars can lead to significant increases in NO2 levels due to explosions, military vehicle emissions, and the burning of various materials. Research has shown that conflict zones often experience spikes in NO2 concentrations as military activities release nitrogen oxides into the atmosphere, which can worsen respiratory and cardiovascular conditions [3,4].
Sulfur Dioxide (SO2)
The destruction of industrial facilities and the use of sulfur-rich fuels in military operations contribute to higher SO2 emissions. These elevated levels can cause acid rain, which negatively impacts agriculture, water systems, and human health, particularly respiratory diseases [5].
Carbon Monoxide (CO)
Fires resulting from infrastructure destruction and the incomplete combustion of fuels release significant amounts of CO into the air. This pollutant poses immediate risks like poisoning and contributes to long-term atmospheric changes, especially in urban areas affected by conflict [6,7].
Aerosol Optical Depth (AOD) is a vital metric in atmospheric sciences that measures the extent to which aerosols, such as dust, smoke, and pollution, obstruct sunlight through scattering or absorption. It is crucial for studying aerosol impacts on climate, air quality, and human health. AOD is typically measured using ground-based instruments like AERONET and satellite sensors, including MODIS, MISR, and Sentinel-5P. Sentinel-5P, equipped with the TROPOMI sensor, provides high-resolution global data on aerosols by detecting sunlight interactions in the atmosphere. The integration of ground and satellite data enhances aerosol monitoring, enabling applications such as identifying pollution sources, tracking dust storms, and analyzing transboundary aerosol movement [8,9].
Indirect effects on air quality
The destruction of power plants, refineries, and urban infrastructure releases a mix of pollutants into the air. Moreover, the limited availability of cleaner energy sources forces populations to rely on biomass burning, further worsening pollution levels [10,11].
Air pollutants such as Nitrogen Dioxide (NO2), Sulfur Dioxide (SO2), Carbon Monoxide (CO), and particulate matter (PM2.5 and PM10) are major environmental health hazards that can cause both acute and chronic health effects in humans and animals.
NO2 is strongly linked to respiratory problems, particularly asthma, with studies indicating a 5% - 10% increased risk for asthma with every 10 µg/m³ increase in NO2 levels. Children are especially vulnerable to the long-term effects of NO2 exposure, which has also been associated with acute respiratory infections such as pneumonia and bronchitis. Additionally, some studies suggest potential developmental neurotoxicity, although the evidence on cognitive impacts is not definitive [12-14].
SO2 primarily affects respiratory health, causing symptoms like bronchoconstriction and decreased lung function during short-term exposure, especially in asthma sufferers. Long-term exposure is linked to the development of Chronic Obstructive Pulmonary Disease (COPD) and cardiovascular problems. Animal studies show similar harmful effects, including respiratory function impairment and growth inhibition [15,16].
CO binds with hemoglobin, forming carboxyhemoglobin, which reduces the blood’s capacity to carry oxygen. This poses severe risks to the cardiovascular and nervous systems. Chronic exposure can worsen heart conditions, and during pregnancy, it can impair fetal development, causing further health complications [17,18].
Aerosol Optical Depth (AOD) is a crucial indicator for assessing air quality and its health impacts, as aerosols, including particulate matter, significantly affect respiratory and cardiovascular health. Research has shown that elevated AOD levels correlate with increased concentrations of fine particles like PM2.5 and PM10, which are particularly harmful. PM2.5 penetrates deeply into the alveoli, contributing to conditions such as asthma, reduced lung function, heart arrhythmias, and nonfatal heart attacks. PM10, which impacts the upper respiratory pathways, is linked to acute respiratory infections and worsens pre-existing respiratory issues. Both are associated with elevated mortality rates due to cardiovascular and respiratory diseases [19-21].
These pollutants also significantly affect animal health. Chronic exposure to NO2, SO2, CO, and particulate matter in wildlife and domesticated animals can result in respiratory distress, weakened immunity, and impaired reproductive health. Such impacts not only endanger animal health but also disrupt ecosystems, threatening biodiversity. To mitigate these far-reaching effects, it is essential to adopt stricter regulatory measures, enforce air quality standards, and promote sustainable practices like reducing industrial emissions and switching to renewable energy sources [22-24].
In conclusion, the adverse impacts of war on air quality exacerbate the levels of harmful pollutants such as NO2, SO2, CO, and AOD, leading to detrimental health outcomes for both humans and animals. Monitoring and mitigating air pollution in post-conflict regions is crucial for safeguarding public health and ecological stability.
Measurement of air pollutants
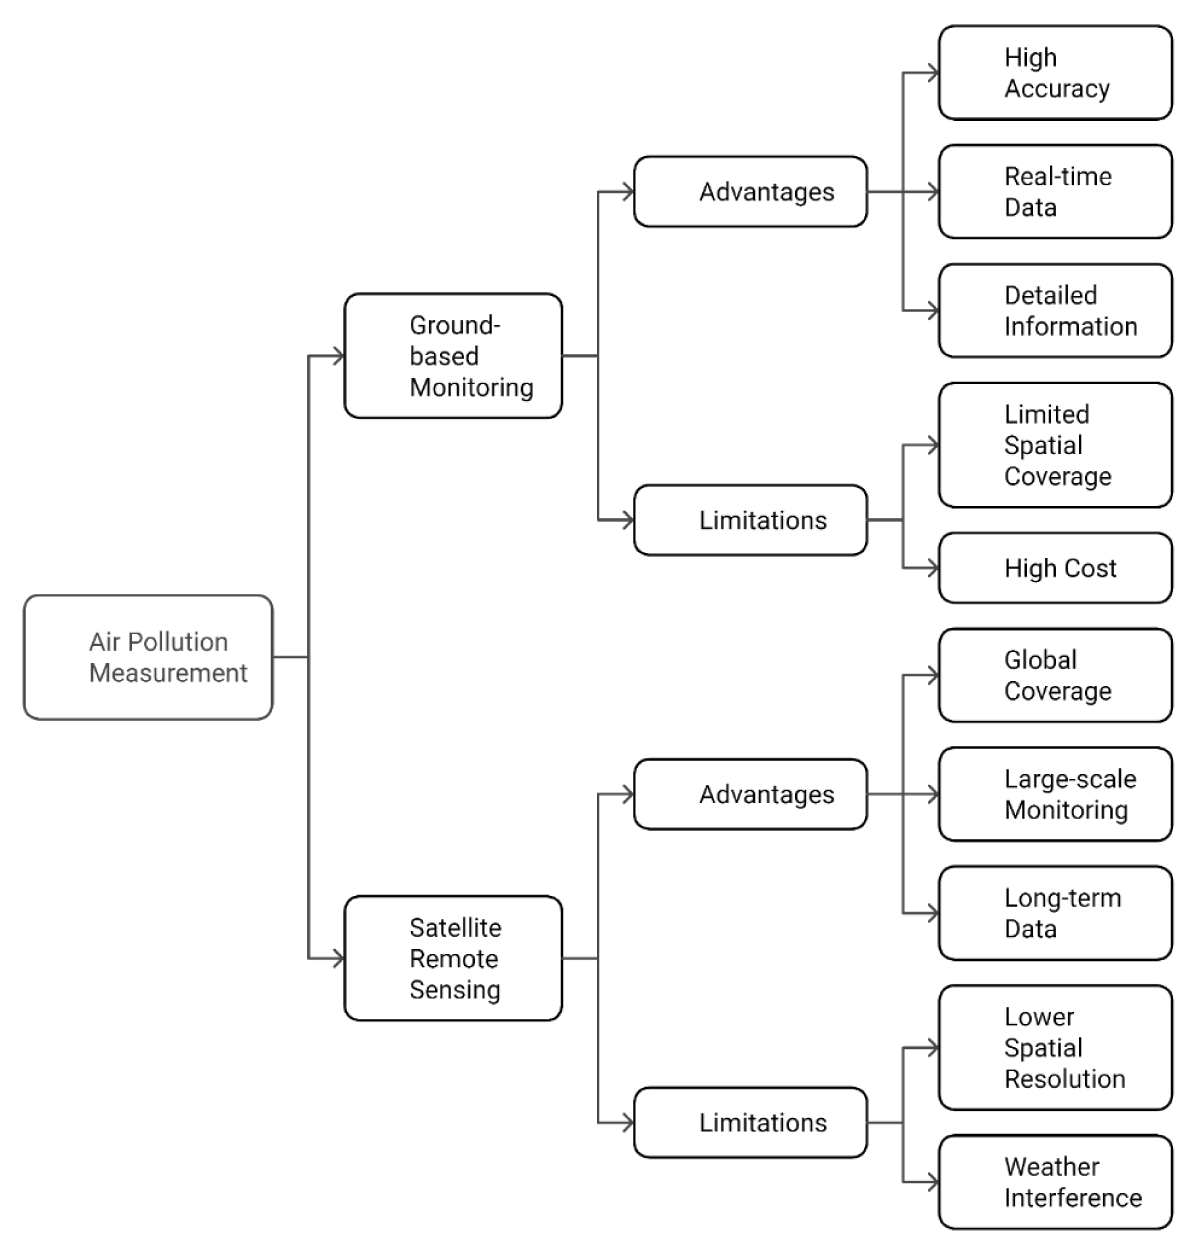
The measurement of air pollutants such as CO, SO2, NO2, and AOD is conducted using both ground-based devices and satellite remote sensing. Each method has distinct strengths and limitations in terms of accuracy, spatial coverage, and temporal resolution as shown in Figure 2.
Figure 2: Measure of Air pollutants.
Ground-based monitoring stations, strategically deployed across urban and rural areas, collect real-time data on air pollutants using various sensor technologies. These include chemical sensors, which directly measure specific pollutants; optical sensors which employ light scattering techniques to assess particulate matter; and electrochemical sensors which detect pollutants by measuring changes in electrical conductivity [25,26].
The advantages of ground-based monitoring include high accuracy, real-time data collection, and the ability to provide detailed information about pollutant composition and sources. However, limitations include their limited spatial coverage, as these stations are often concentrated in urban areas and the high cost of establishing and maintaining such networks. Additionally, measurements can be affected by local factors such as traffic patterns and meteorological conditions, which can influence the accuracy of the data collected in specific locations [27-29].
Satellite remote sensing utilizes specialized sensors aboard satellites to monitor air pollution from space by detecting and measuring pollutants through the analysis of electromagnetic radiation emitted or reflected by the Earth’s atmosphere. One of its key strengths is global coverage, allowing for the monitoring of remote and inaccessible regions. Additionally, satellite remote sensing provides large-scale monitoring capabilities, enabling the analysis of air pollution trends and patterns over wide geographical areas. Long-term data from satellites also supports the examination of temporal trends in air pollution, making it invaluable for environmental research. However, there are notable limitations, including lower spatial resolution compared to ground-based measurements, which may hinder the ability to detect localized pollution sources accurately. Furthermore, satellite sensors might be less accurate in measuring specific pollutants, particularly those at low concentrations. Finally, satellite observations can be significantly affected by weather conditions, such as cloud cover or atmospheric interference, which may compromise the accuracy of data during certain times or in specific regions [30-32].
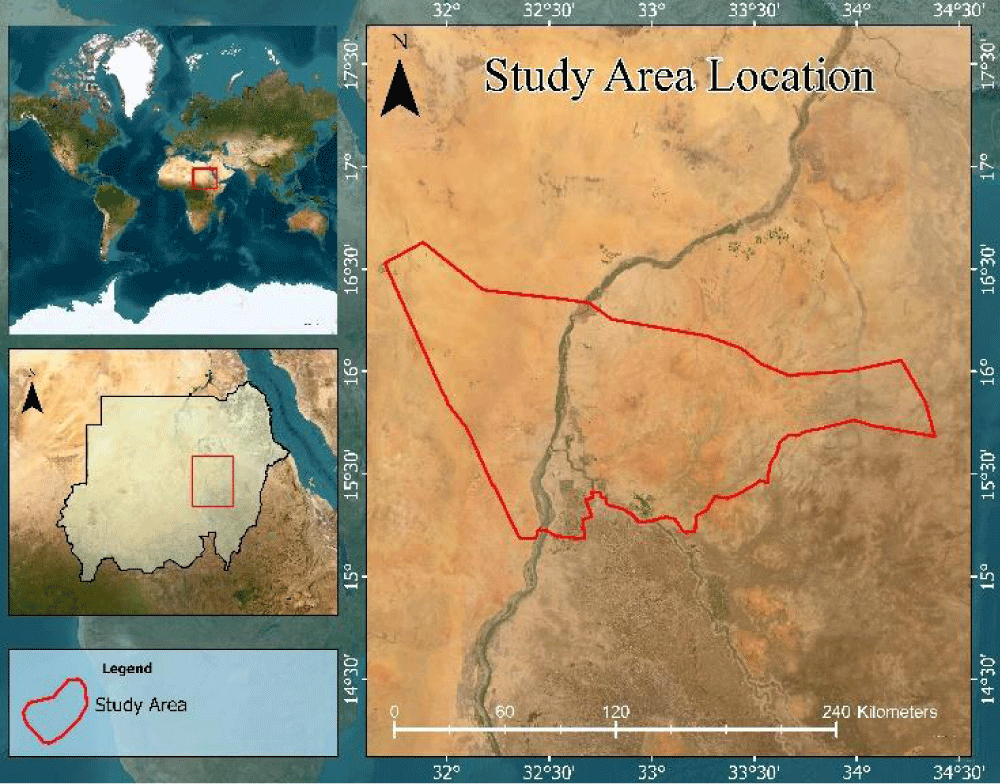
Study area location
Khartoum, the capital of Sudan, is strategically located at the confluence of the Blue Nile and White Nile rivers, between latitudes 15°20’ N–15°45’ N and longitudes 32°25’ E–32°40’ E as shown in Figures 3,4, covering approximately 1,010 square kilometers. It features a semi-arid climate with rapid urbanization and population growth, serving as Sudan’s political and economic hub with significant historical and geographical importance [33,34].
Figure 3: Study Area Location.
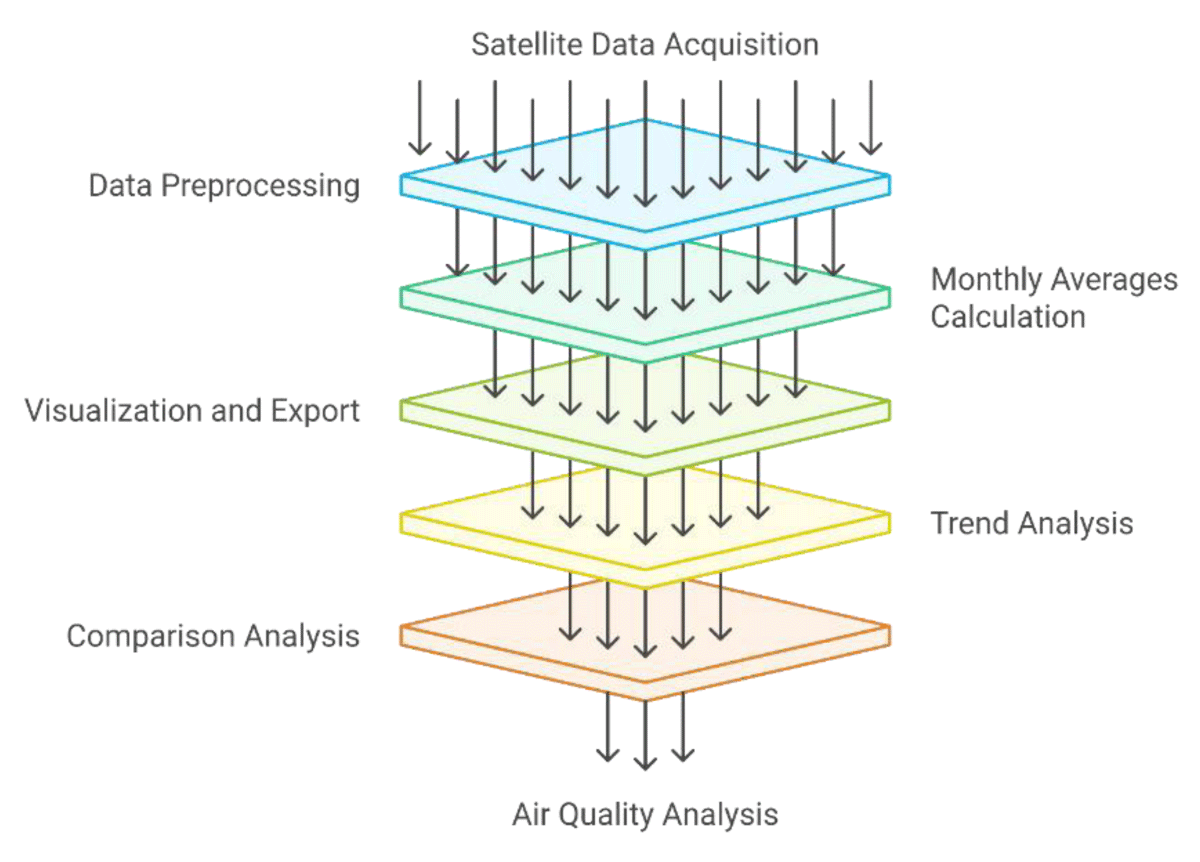
Figure 4: Air Quality Analysis.
This study investigates the temporal changes in air pollutants Aerosol Optical Depth (AOD), Carbon Monoxide (CO), Nitrogen Dioxide (NO2), and Sulfur Dioxide (SO2) in Khartoum, Sudan, before and after a significant war event. The methodology encompasses data acquisition, preprocessing, analysis, and visualization using Google Earth Engine (GEE), ArcGIS Pro, and Microsoft Excel.
The study focuses on the Khartoum region, with spatial boundaries defined using a shapefile obtained from local authoritative sources. This shapefile was uploaded to GEE as a vector layer for spatial masking and further analysis.
Data acquisition
Satellite data from the Sentinel-5P mission were used to analyze pollutant levels:
- AOD: Derived from Sentinel-5P NRTI L3_AER_AI product.
- CO: Column number density from the Sentinel-5P NRTI L3_CO product.
- NO2: Column number density from the Sentinel-5P NRTI L3_NO2 product.
- SO2: Column number density from the Sentinel-5P NRTI L3_SO2 product.
These datasets, with a spatial resolution of 7 km, were accessed through GEE for the period January 1, 2020, to December 31, 2024. Invalid values were masked during preprocessing to ensure data accuracy.
Data preprocessing
Preprocessing was conducted entirely in GEE and involved:
- Filtering by Region: Each dataset was masked using the Khartoum shapefile.
- Temporal Filtering: Data was restricted to the period from 2020 to 2024.
- Cloud and Noise Removal: Invalid and noisy pixels were masked using dataset-specific flags.
- Clipping: All datasets were clipped to the Khartoum region for uniformity.
Computation of monthly averages
Monthly averages for each pollutant were calculated to analyze seasonal and yearly variations. A year-month property was added to the images, allowing data to be grouped by month. Monthly mean composites were computed using the mean() function and exported for further analysis.
Visualization and data export
- Maps: Pollutant concentrations were visualized in GEE with color palettes (blue, green, yellow, red) representing increasing levels.
- Export to Geo TIFF: Monthly mean images were exported to Google Drive in GeoTIFF format for spatial analysis in ArcGIS Pro.
- Temporal trends: Line charts showing pollutant trends were generated in GEE and refined in Microsoft Excel.
Trend analysis in microsoft excel
Monthly averages exported from GEE were analyzed in Excel:
- Line charts were created to illustrate pollutant fluctuations before and after the war.
- Seasonal patterns and abrupt changes linked to the war timeline were highlighted.
Comparison of pre- and post-war periods
Data was divided into two periods: before the war (2020–April 2023) and after the war (May 2023–December 2024). Statistical comparisons were performed using:
- Descriptive statistics: Mean and standard deviation for each pollutant.
- Correlation analysis: Pearson’s correlation coefficients to identify relationships between pollutants and external factors.
Software and tools
The following tools were used:
- Google earth engine: For data acquisition, processing, and visualization.
- ArcGIS pro (version 3.4.1): For detailed mapping and spatial analysis.
- Microsoft excel: For trend analysis and charting.
Output
The study produced:
1. High-resolution maps showing the spatial distribution of pollutants (PM2.5, CO, NO2, SO2) before and after the war.
2. Temporal charts highlighting changes in pollutant levels.
3. Insights into pollutant variations linked to socio-political disruptions and seasonal patterns.
This methodology provides a comprehensive approach to analyzing the impact of socio-political events on air quality using satellite data and geospatial technologies, offering critical insights for environmental policy and urban planning.
The results of this study reveal significant temporal and spatial variations in air pollutant concentrations in Khartoum before and after the onset of the war in April 2023. These findings underscore the impact of socio-political disruptions on air quality, reflecting changes in both anthropogenic and environmental emission patterns. Using high-resolution satellite data and geospatial analysis, the study identifies notable trends across different pollutants, with each indicator revealing unique dynamics in response to conflict-related activities and their aftermath. The results are detailed for each pollutant as follows:
AOD
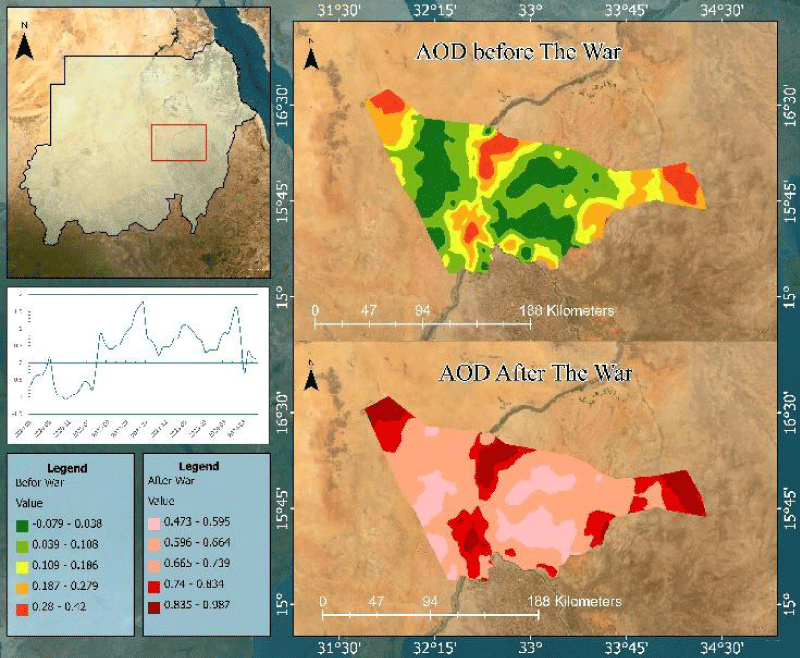
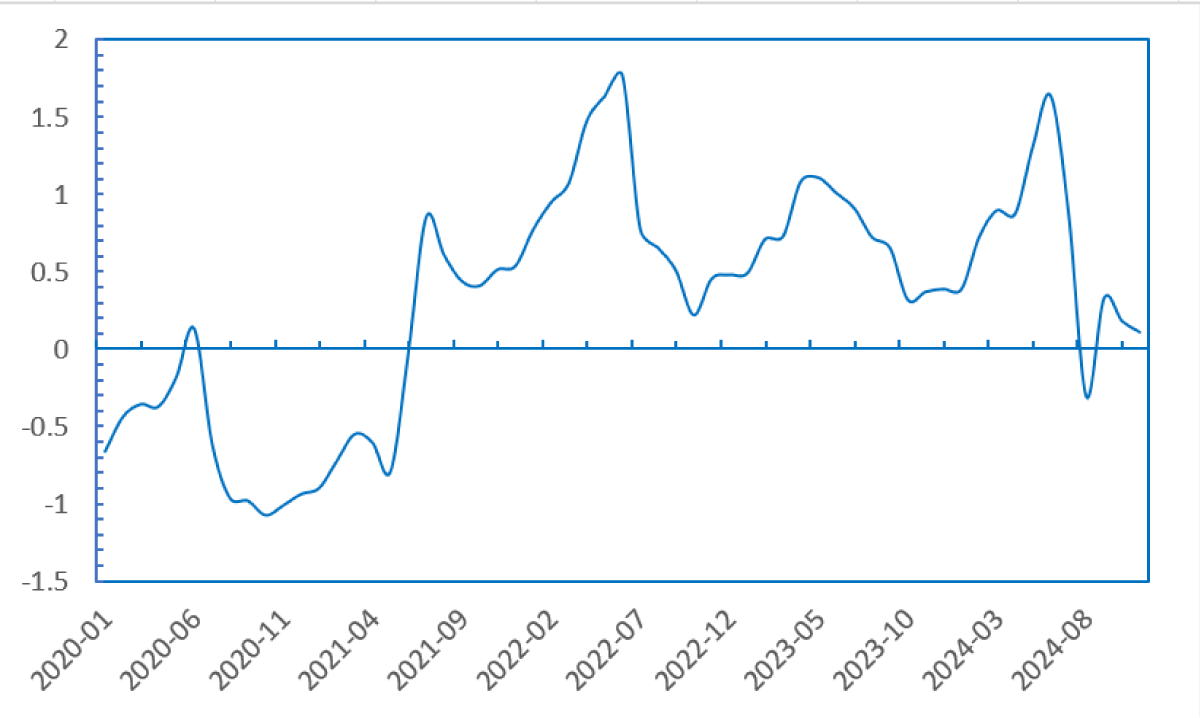
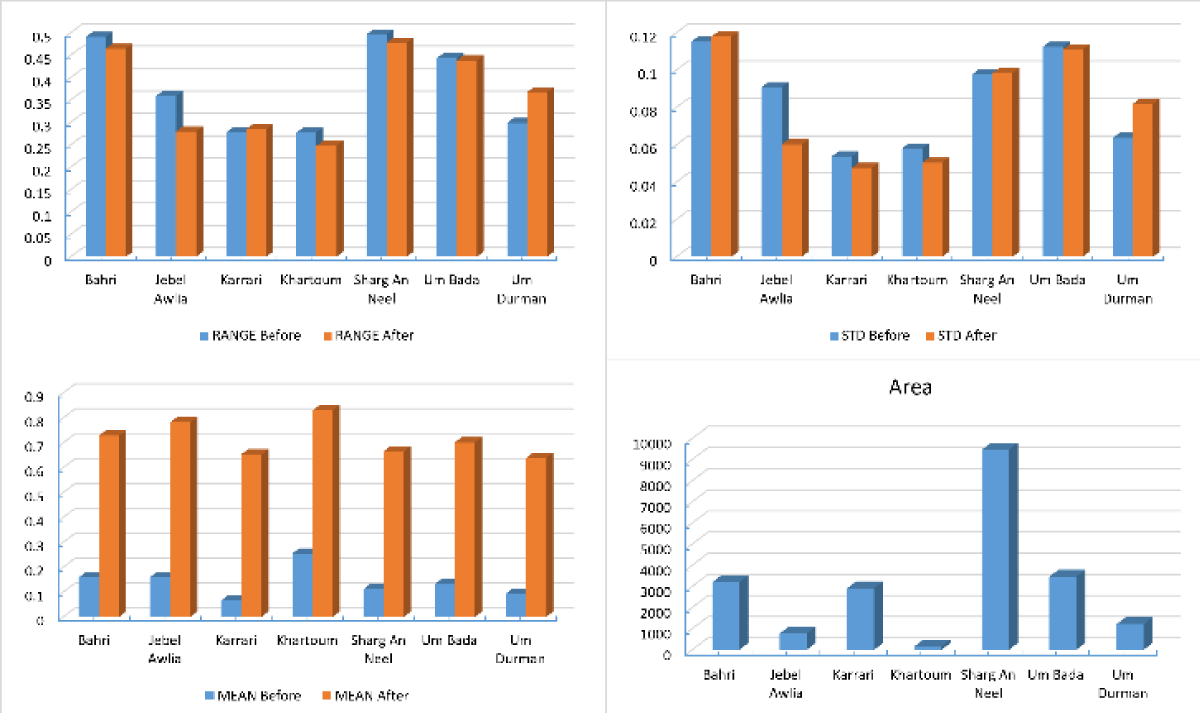
The analysis of Aerosol Optical Depth (AOD) values, provides critical insights into the atmospheric changes in Khartoum before and after the war as shown in Figures 5-7. AOD, as an indicator of aerosol concentrations, reflects variations in air pollution levels influenced by environmental and anthropogenic factors. The findings reveal notable spatial and temporal patterns of aerosol distribution across different areas of Khartoum.
Figure 5: Mean Aerosol Optical Depth.
Figure 6: Aerosol Optical Depth Trends.
Figure 7: AOD Comparison Before and After War.
A marked increase in mean AOD values was observed across all areas post-war, indicating a significant escalation in aerosol concentrations. This surge is likely attributed to conflict-related activities such as infrastructure destruction, fires, and reduced industrial oversight, contributing to elevated levels of dust, debris, and emissions. Interestingly, the range of AOD values decreased in several areas, such as Bahri and Sharg Alneel, reflecting a more uniform aerosol distribution. This uniformity suggests consistent pollution sources, primarily driven by widespread destruction rather than localized industrial activities. The reduction in standard deviation in areas like Jebel Awlia and Karary further supports this finding, pointing to decreased variability in aerosol sources post-war.
Pre-war negative minimum AOD values, observed in some areas, may result from satellite data calibration issues or extreme meteorological conditions, such as periods of exceptionally clear skies.
Regional trends:
- Bahri: Pre-war conditions indicated moderate pollution levels (mean AOD = 0.158) as shown in Table 1. Post-war, the mean AOD surged to 0.728, with significantly higher maximum values, highlighting severe air quality degradation due to conflict-related emissions and activities.
- Jebel Awlia: Characterized by lower variability and relatively clean air pre-war (mean AOD = 0.159), this area experienced a dramatic post-war increase in mean AOD to 0.781, coupled with a narrower range, indicative of consistent and heightened pollution levels.
- Karary: Although this area exhibited the smallest increase in standard deviation post-war, the mean AOD rose substantially from 0.065 to 0.653, suggesting an overall decline in air quality with a more homogeneous distribution of aerosols.
- Khartoum (City Center): As the capital, Khartoum consistently exhibited higher AOD values, which further escalated post-war. The significant rise in both mean and maximum AOD underscores the compounded effect of urban density and conflict-driven emissions.
- Sharg Alneel: A sharp increase in mean AOD (from 0.111 to 0.665) post-war indicates substantial pollution accumulation, likely due to disturbed vegetation and heightened soil erosion from war activities.
- Um Bada and Um Durman: These areas showed trends similar to other regions, with increased mean and maximum AOD values post-war. However, the consistent standard deviation in areas like Um Bada suggests the amplification of pre-existing pollution sources rather than the introduction of new ones.
| Table 1: AOD Value Before and After. | ||||||||||
| Name | Minimum value | Maximum value | MEAN value | Standard Deviation | RANGE | |||||
| Before | After | Before | After | Before | After | Before | After | Before | After | |
| Bahri | -0.079972 | 0.501953 | 0.41062 | 0.966321 | 0.158079 | 0.728273 | 0.11525 | 0.117947 | 0.490592 | 0.464367 |
| Jebel Awlia | 0.019646 | 0.663806 | 0.378304 | 0.943287 | 0.159198 | 0.781897 | 0.090888 | 0.060073 | 0.358657 | 0.279481 |
| Karary | -0.024048 | 0.556562 | 0.253589 | 0.841189 | 0.065043 | 0.653264 | 0.053801 | 0.047633 | 0.277637 | 0.284627 |
| Khartoum | 0.095995 | 0.690989 | 0.373269 | 0.938351 | 0.25401 | 0.829435 | 0.05811 | 0.050377 | 0.277274 | 0.247363 |
| Sharg Alneel | -0.07853 | 0.47208 | 0.417761 | 0.949764 | 0.111361 | 0.665556 | 0.097853 | 0.098336 | 0.496291 | 0.477684 |
| Um Bada | -0.023674 | 0.549092 | 0.419632 | 0.987352 | 0.130688 | 0.701166 | 0.112435 | 0.111046 | 0.443306 | 0.43826 |
| Um Durman | -0.038692 | 0.480479 | 0.259791 | 0.847875 | 0.092646 | 0.638282 | 0.063701 | 0.082054 | 0.298483 | 0.367396 |
CO
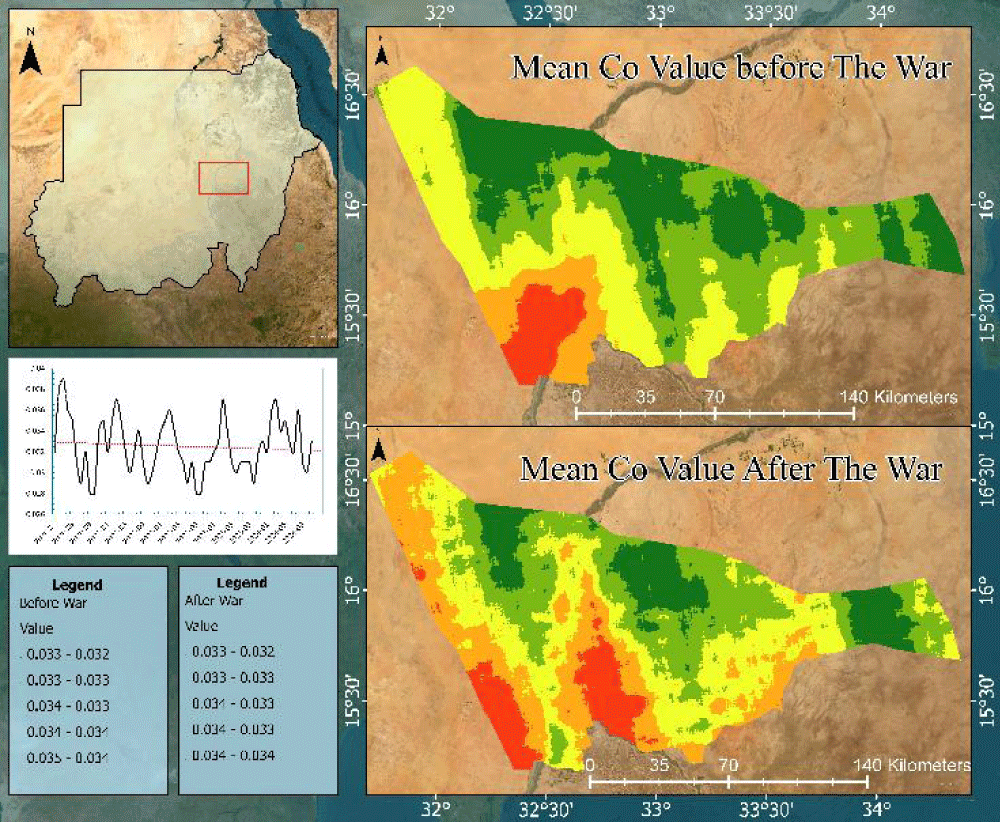
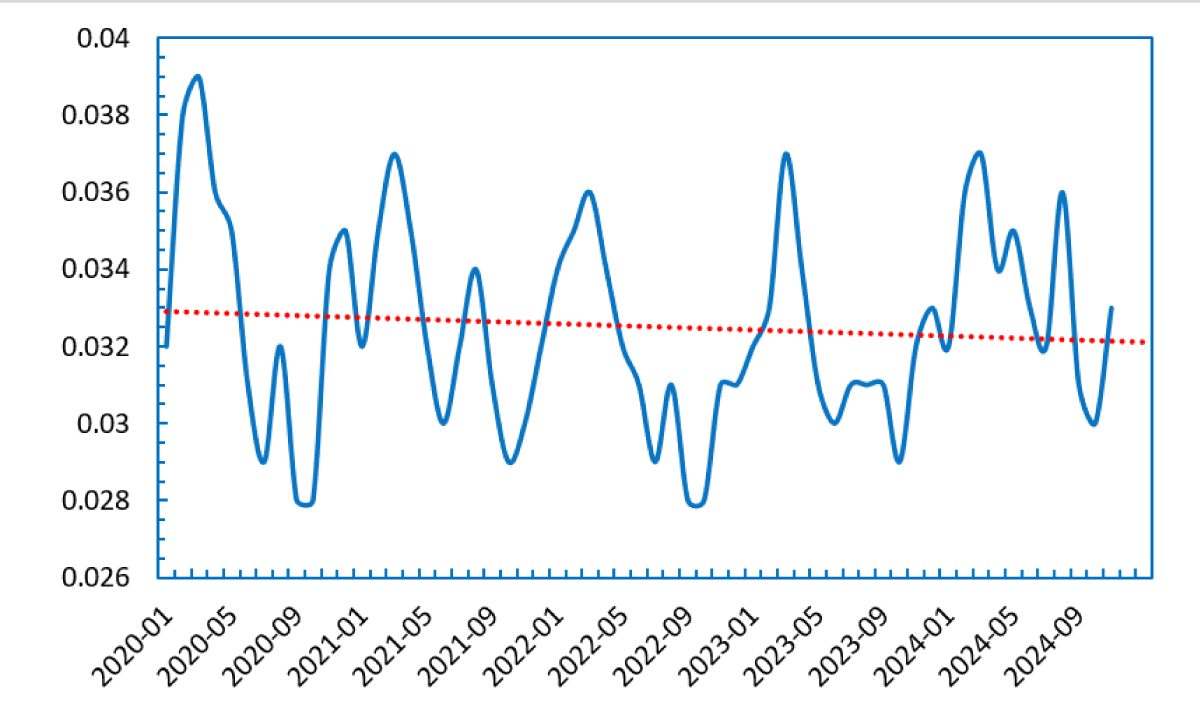
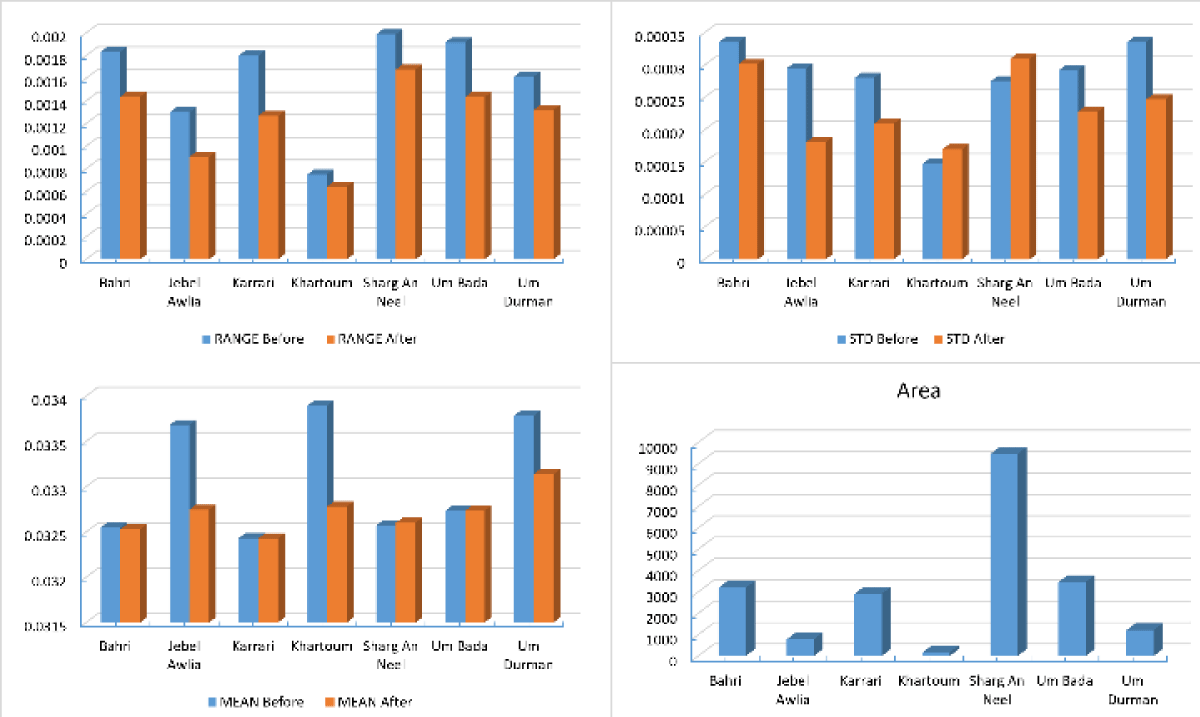
The analysis of carbon monoxide (CO) concentration statistics before and after the onset of war in Khartoum reveals key insights into regional and temporal changes in air quality. Carbon monoxide, primarily emitted by transportation and industrial activities, serves as a critical indicator of anthropogenic air pollution. Across all studied regions, the mean CO values exhibit a slight decline post-war, suggesting an overall reduction in CO emissions. This trend likely reflects decreased industrial operations, reduced vehicular traffic, and diminished human activities due to the conflict. Similarly, maximum CO values show a notable decrease as shown in Figures 8-10 indicating fewer extreme pollution events. The observed reduction in standard deviation and range highlights a more uniform and less fluctuating distribution of CO levels across the regions post-war.
Figure 8: Mean CO value before and after the war.
Figure 9: Mean CO value.
Figure 10: AOD Comparison Before and After War.
Regional trends:
- Bahri: A marginal decrease in the mean CO value (from 0.0325516 to 0.0325305) as shown in Table 2 is accompanied by a slight reduction in standard deviation and range, reflecting moderate and stable reductions in emissions likely tied to lower urban activity.
- Jebel Awlia: This region demonstrates the most substantial decline in mean CO levels (from 0.0336813 to 0.032746), along with significant reductions in standard deviation and range. These changes suggest major disruptions to industrial or transportation activities, resulting in a more uniform and lower CO concentration profile.
- Karary: With a nearly unchanged mean CO value (0.0324311 pre-war vs. 0.0324291 post-war), this region shows stable emission patterns despite the conflict. However, a reduction in range indicates a decrease in extreme CO concentration events.
- Khartoum (City Center): The capital exhibits a noticeable decrease in mean CO levels (from 0.0338951 to 0.0327805), coupled with reductions in standard deviation and range. As a center for economic activity, these trends are likely driven by reduced industrial and vehicular emissions during the conflict.
- Sharg Alneel: Contrary to other regions, a slight increase in mean CO value (from 0.0325722 to 0.0326014) is observed post-war. This anomaly may reflect localized emission sources, such as intensified generator usage or population displacement leading to concentrated activities.
- Um Bada: Despite stable mean CO levels (0.032733 pre-war vs. 0.0327336 post-war), the reduced range indicates fewer extreme variations in concentrations, suggesting a shift toward more consistent pollution patterns.
- Um Durman: A clear reduction in mean CO levels (from 0.0337834 to 0.033138) is observed, along with decreased range and standard deviation. These findings align with broader post-war trends of reduced emissions and variability.
| Table 2: AOD Value Before and After. | ||||||||||
| Name | Minimum value | Maximum value | MEAN value | Standard Deviation | RANGE | |||||
| Before | After | Before | After | Before | After | Before | After | Before | After | |
| Bahri | 0.0319299 | 0.0318417 | 0.0337656 | 0.033279878 | 0.0325516 | 0.0325305 | 0.0003356 | 0.0003017 | 0.0018358 | 0.0014382 |
| Jebel Awlia | 0.0331011 | 0.0322515 | 0.0344003 | 0.033156346 | 0.0336813 | 0.032746 | 0.0002955 | 0.0001811 | 0.0012991 | 0.0009048 |
| Karary | 0.0317615 | 0.0318323 | 0.0335615 | 0.033099375 | 0.0324311 | 0.0324291 | 0.0002807 | 0.00021 | 0.0018001 | 0.0012671 |
| Khartoum | 0.0335229 | 0.0324644 | 0.0342728 | 0.033106834 | 0.0338951 | 0.0327805 | 0.0001482 | 0.0001702 | 0.00075 | 0.0006424 |
| Sharg Alneel | 0.0320692 | 0.0318337 | 0.0340581 | 0.033512319 | 0.0325722 | 0.0326014 | 0.0002755 | 0.0003101 | 0.0019888 | 0.0016786 |
| Um Bada | 0.0319589 | 0.0318124 | 0.0338747 | 0.033244976 | 0.032733 | 0.0327336 | 0.0002924 | 0.0002285 | 0.0019158 | 0.0014326 |
| Um Durman | 0.0327734 | 0.0324188 | 0.0343886 | 0.033738449 | 0.0337834 | 0.033138 | 0.0003355 | 0.0002474 | 0.0016152 | 0.0013196 |
NO2
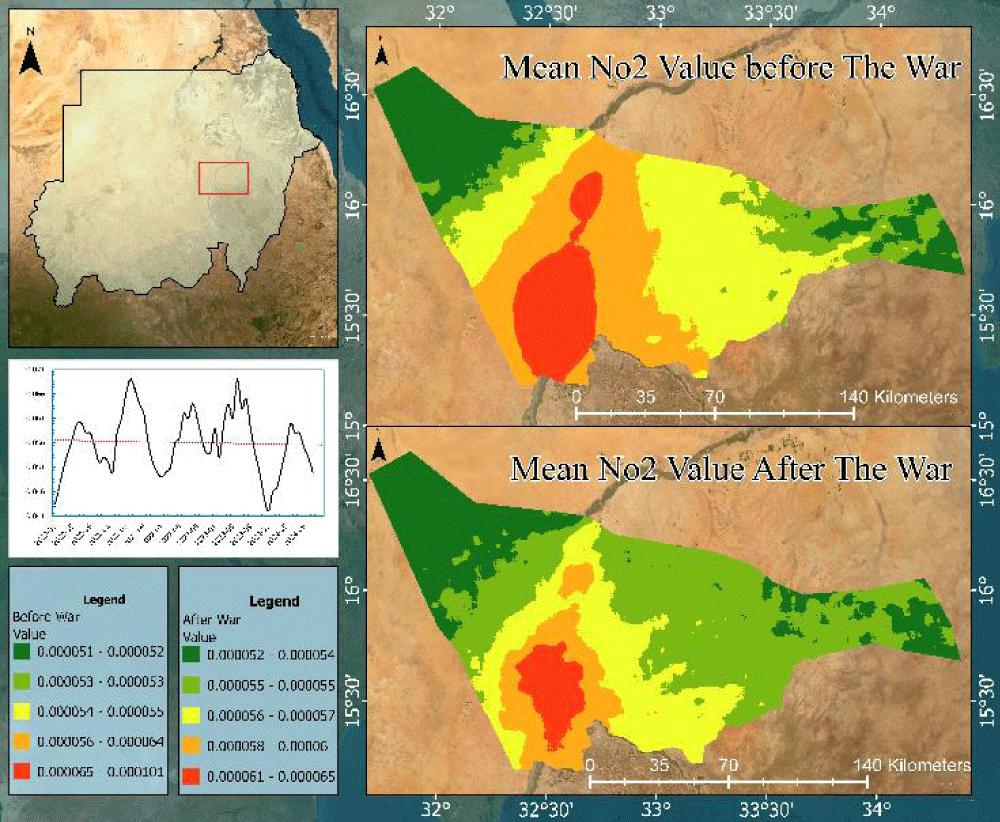
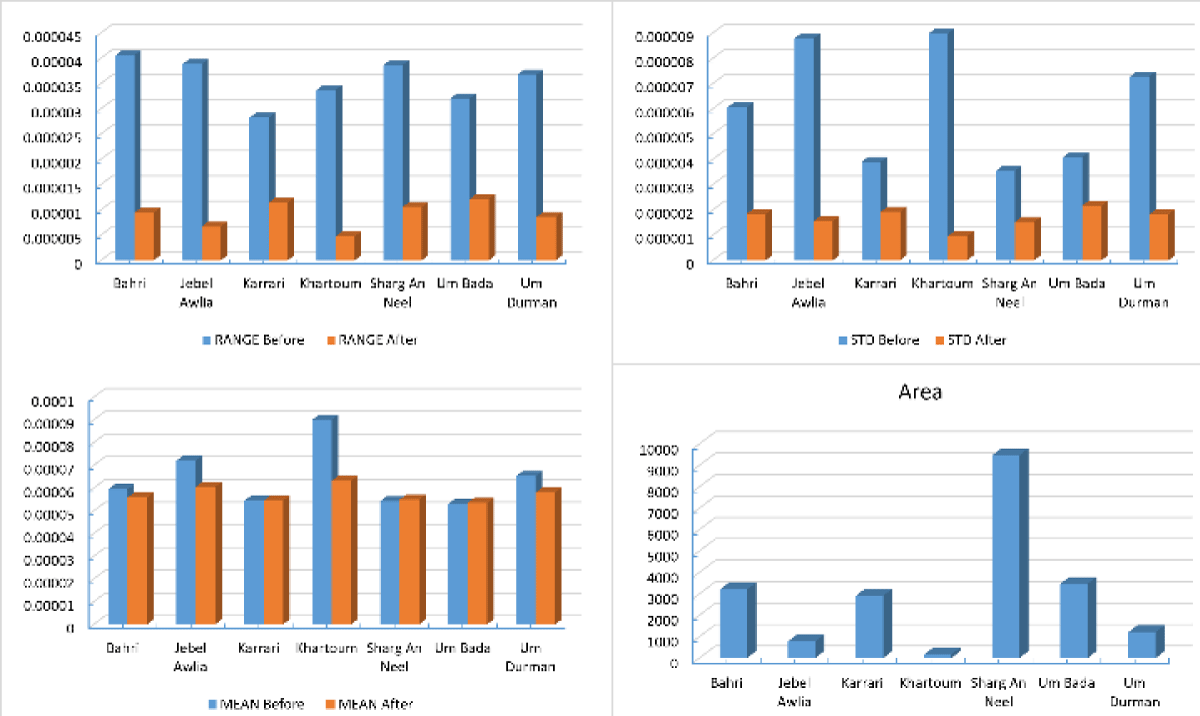
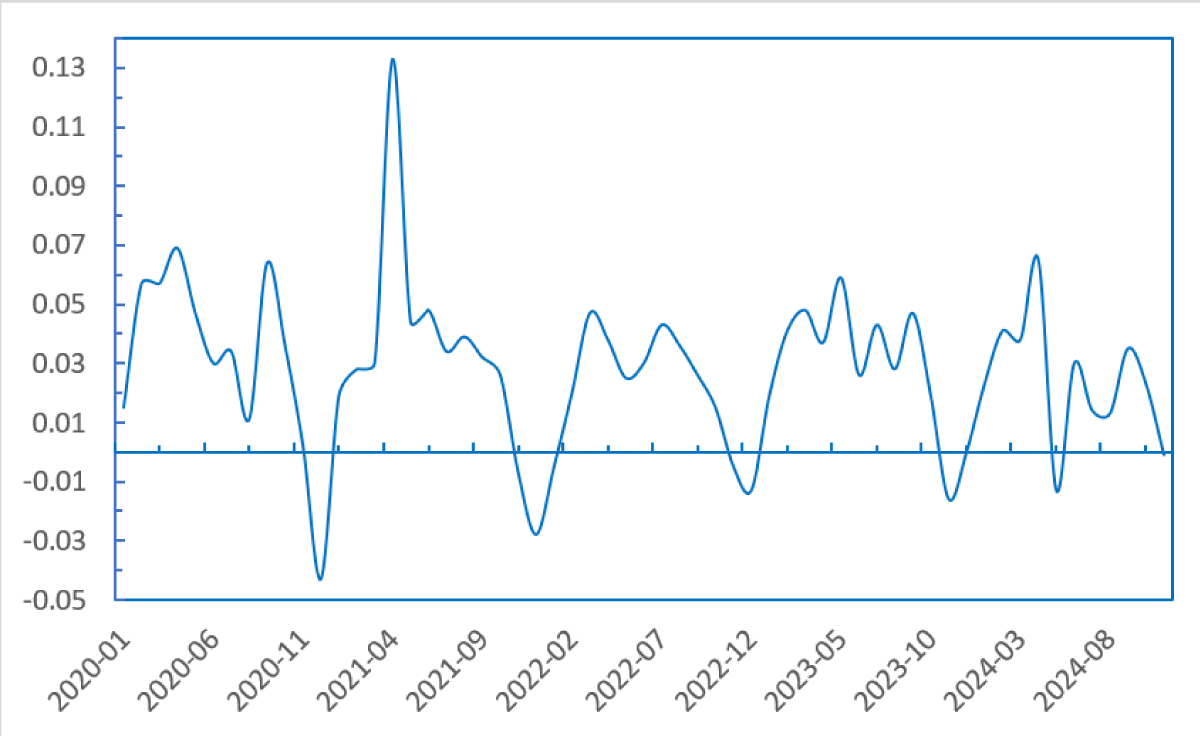
The analysis of nitrogen dioxide (NO2) concentration statistics before and after the onset of war in Khartoum, highlights significant temporal and regional changes in air quality as shown in Figures 11-13. Nitrogen dioxide, a key pollutant primarily emitted from vehicular and industrial sources, provides critical insights into the dynamics of anthropogenic pollution during conflict periods.
Figure 11: Mean NO2 value before and after the war.
Figure 12: Mean NO2 value.
Figure 13: NO2 Comparison Before and After War.
A consistent decline in mean NO2 concentrations across all regions post-war reflects a significant reduction in emissions. This trend is likely associated with decreased industrial activities, reduced vehicular traffic, and disruptions to daily life due to the conflict. Maximum NO2 concentrations also show substantial reductions, indicating fewer extreme pollution events. The narrowing range and lower standard deviation suggest a more uniform distribution of NO2 levels, with reduced spatial and temporal fluctuations.
Regional trends:
- Bahri: The mean NO2 concentration dropped from 5.95 × 10⁻⁵ to 5.59 × 10⁻⁵ as shown in Table 3, accompanied by a slight reduction in standard deviation and range. These changes indicate moderate reductions in emissions, likely linked to reduced urban activity and transportation disruptions.
- Jebel Awlia: This region exhibits one of the most significant decreases in NO2 levels, with the mean value dropping from 8.78 × 10⁻⁶ to 1.55 × 10⁻⁶. The corresponding reductions in standard deviation and range suggest a more consistent and lower emission profile, likely due to severe disruptions in industrial and transportation activities.
- Khartoum (City Center): The capital experienced a marked reduction in mean NO2 concentrations, from 9.01 × 10⁻⁵ to 6.31 × 10⁻⁵. The sharp decrease in maximum values and a narrower range highlight the impact of reduced economic activities on pollution levels, with fewer high-emission events.
- Sharg Alneel: Unlike other districts, Sharg Alneel shows a slight increase in mean NO2 concentrations post-war, rising from 5.27 × 10⁻⁵ to 5.33 × 10⁻⁵. This anomaly could be attributed to localized factors, such as population displacement or increased generator usage due to power shortages.
- Um Bada: The mean NO2 levels remain relatively stable (from 5.27 × 10⁻⁵ to 5.33 × 10⁻⁵ however, a significant reduction in range suggests fewer extreme pollution events, reflecting a more consistent pattern of emissions.
- Um Durman: A notable decline in mean NO2 concentrations, from 3.37 × 10⁻⁵ to 4.71 × 10⁻⁵ is observed, along with decreases in standard deviation and range. These findings align with the broader trend of reduced emissions, reflecting a stabilization of activities during the conflict.
| Table 3: NO2 Value Before and After. | ||||||||||
| Name | Minimum value | Maximum value | MEAN value | Standard Deviation | RANGE | |||||
| Before | After | Before | After | Before | After | Before | After | Before | After | |
| Bahri | 5.26597E-05 | 5.33189E-05 | 9.3222E-05 | 6.27607E-05 | 5.94954E-05 | 5.59196E-05 | 6.04789E-06 | 1.83503E-06 | 4.05623E-05 | 9.44171E-06 |
| Jebel Awlia | 6.05882E-05 | 5.82078E-05 | 9.93967E-05 | 6.48528E-05 | 7.20246E-05 | 6.04992E-05 | 8.78243E-06 | 1.54645E-06 | 3.88084E-05 | 6.64509E-06 |
| Karary | 5.00208E-05 | 5.14826E-05 | 7.82361E-05 | 6.28895E-05 | 5.44363E-05 | 5.44325E-05 | 3.89556E-06 | 1.91728E-06 | 2.82153E-05 | 1.14069E-05 |
| Khartoum | 6.74394E-05 | 6.01566E-05 | 0.000101147 | 6.4866E-05 | 9.00861E-05 | 6.31683E-05 | 8.97574E-06 | 9.56631E-07 | 3.37071E-05 | 4.70942E-06 |
| Sharg Alneel | 5.09863E-05 | 5.24142E-05 | 8.96209E-05 | 6.29798E-05 | 5.42503E-05 | 5.49466E-05 | 3.5402E-06 | 1.51801E-06 | 3.86346E-05 | 1.05656E-05 |
| Um Bada | 4.97617E-05 | 5.09054E-05 | 8.18089E-05 | 6.30137E-05 | 5.30543E-05 | 5.35319E-05 | 4.08096E-06 | 2.15848E-06 | 3.20472E-05 | 1.21083E-05 |
| Um Durman | 5.34894E-05 | 5.43176E-05 | 9.02129E-05 | 6.29104E-05 | 6.53494E-05 | 5.80634E-05 | 7.27446E-06 | 1.81407E-06 | 3.67236E-05 | 8.59284E-06 |
SO2
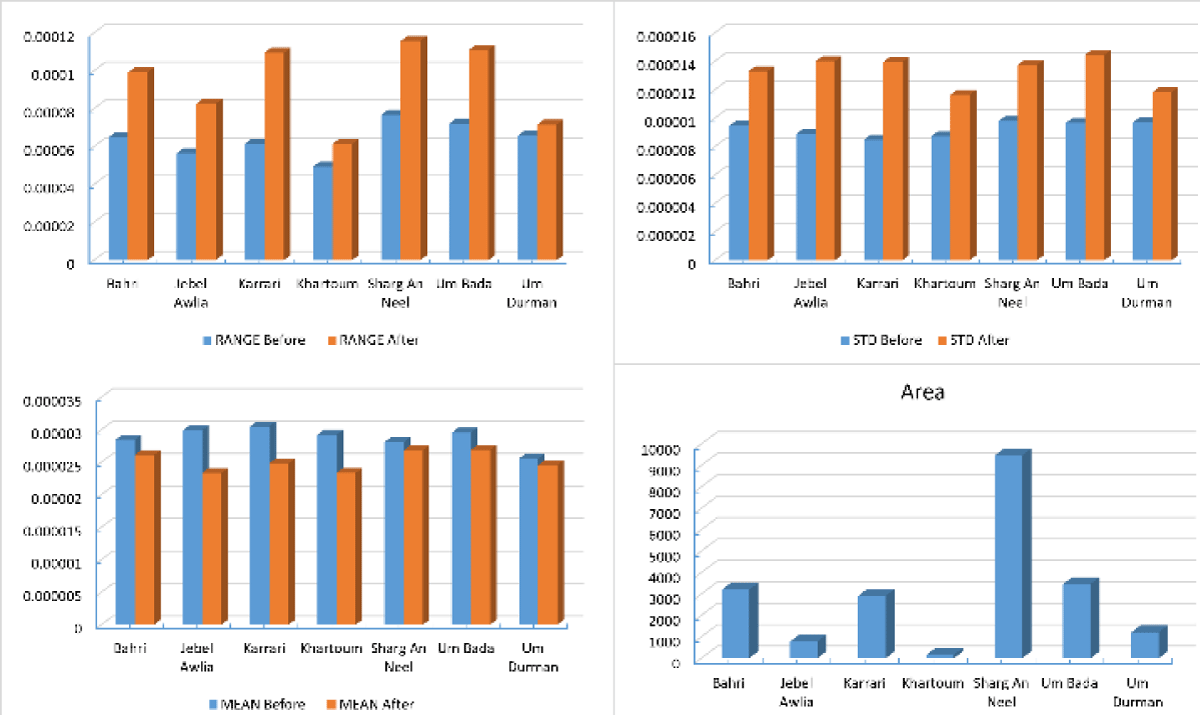
The results in Table 4 provide an insightful analysis of the sulfur dioxide (SO2) values before and after the war in different areas of Khartoum. SO2 is a critical indicator of air quality, reflecting emissions from industrial processes, combustion of fossil fuels, and other anthropogenic activities. The analysis of sulfur dioxide (SO2) concentration statistics before and after the onset of war in Khartoum, as detailed in the presented data table, reveals substantial temporal and spatial changes in air quality as shown in Figures 14-16. SO2, primarily emitted from industrial and vehicular activities, offers critical insights into the dynamics of anthropogenic emissions during periods of conflict.
| Table 4: SO2 Value Before and After. | ||||||||||
| Name | Minimum value | Maximum value | MEAN value | Standard Deviation | RANGE | |||||
| Before | After | Before | After | Before | After | Before | After | Before | After | |
| Bahri | -4.29E-06 | -2.9E-05 | 6.06E-05 | 7.02E-05 | 2.85E-05 | 2.61E-05 | 9.46E-06 | 1.33E-05 | 6.49E-05 | 9.91E-05 |
| Jebel Awlia | 2.96E-06 | -2.32E-05 | 5.94E-05 | 5.94E-05 | 2.99E-05 | 2.33E-05 | 8.9E-06 | 1.4E-05 | 5.65E-05 | 8.26E-05 |
| Karary | 2.27E-06 | -3.19E-05 | 6.38E-05 | 7.76E-05 | 3.05E-05 | 2.48E-05 | 8.47E-06 | 1.39E-05 | 6.15E-05 | 0.00011 |
| Khartoum | 2.45E-06 | -6.03E-06 | 5.19E-05 | 5.54E-05 | 2.92E-05 | 2.34E-05 | 8.72E-06 | 1.16E-05 | 4.94E-05 | 6.14E-05 |
| Sharg Alneel | -1.23E-05 | -3.29E-05 | 6.45E-05 | 8.28E-05 | 2.81E-05 | 2.68E-05 | 9.79E-06 | 1.37E-05 | 7.68E-05 | 0.000116 |
| Um Bada | -9.24E-06 | -3.44E-05 | 6.3E-05 | 7.66E-05 | 2.96E-05 | 2.69E-05 | 9.66E-06 | 1.44E-05 | 7.22E-05 | 0.000111 |
| Um Durman | -5.85E-06 | -1.22E-05 | 5.98E-05 | 5.94E-05 | 2.55E-05 | 2.46E-05 | 9.71E-06 | 1.18E-05 | 6.56E-05 | 7.16E-05 |
Figure 14: Mean SO2 value before and after the war.
Figure 15: Mean NO2 value.
Figure 16: SO2 Comparison Before and After War.
A general decline in mean SO2 concentrations across most regions post-war suggests a significant reduction in emissions. This trend is likely due to disruptions in industrial operations, reduced vehicular traffic, and the cessation of some economic activities. However, the increased range and standard deviation of SO2 values point to heightened variability, with more frequent extreme fluctuations in pollution levels. These irregularities may be linked to sporadic pollution events such as emergency fuel combustion or localized power generation. Negative minimum values recorded in certain areas post-war raise questions about potential calibration errors or periods of negligible emissions, warranting further investigation.
Regional trends:
- Bahri: The mean SO2 concentration declined modestly from 2.85 × 10⁻⁵ to 2.61 × 10⁻⁵, reflecting a reduction in urban emissions. However, maximum concentrations rose from 6.06 × 10⁻⁵ to 7.02 × 10⁻⁵, alongside increased variability, likely caused by sporadic conflict-related pollution events.
- Jebel Awlia: This area experienced a significant drop in mean SO2 levels from 2.99 × 10⁻⁵ to 2.33 × 10⁻⁵, indicative of reduced overall emissions. Despite this, the range expanded, suggesting heightened variability due to localized emission sources or emergency activities during the conflict.
- Karary: A notable decrease in the mean SO2 concentration, from 3.05 × 10⁻⁵ to 2.48 × 10⁻⁵, was observed, accompanied by a significant increase in the range. This points to irregular pollution events, likely tied to fuel combustion or other conflict-induced activities.
- Khartoum (City Center): The capital exhibited a reduction in mean SO2 concentrations, from 2.92 × 10⁻⁵ to 2.34 × 10⁻⁵, highlighting the impact of reduced vehicular and industrial emissions. However, increased variability and maximum values indicate sporadic high-emission events, reflecting localized disruptions.
- Sharg Alneel: While mean SO2 levels showed a slight increase from 2.81 × 10⁻⁵ to 2.68 ×10⁻⁵, the range and maximum values rose dramatically, indicating intensified localized emissions. This anomaly could stem from conflict-related factors, such as population displacement or increased generator use.
- Um Bada: The mean SO2 concentration decreased slightly from 2.96 × 10⁻⁵ to 2.69 × 10⁻⁵, with a significant expansion in the range from 7.22 × 10⁻⁵ to 1.11 × 10⁻⁴. These findings suggest more frequent extreme pollution events, likely driven by localized emission sources.
- Um Durman: A relatively stable mean SO2 concentration, declining from 2.55 × 10⁻⁵ to 2.46 × 10⁻⁵, was observed, with a slight increase in the range. This reflects more sporadic fluctuations in emissions, potentially linked to conflict-related disruptions.
The following recommendations aim to guide future research on the impacts of socio-political disruptions on air quality in Khartoum:
- Extended longitudinal studies: Explore the long-term impacts of socio-political disruptions on air quality and public health to identify persistent patterns and effects.
- Enhanced data precision: Utilize high-resolution satellite data and advanced remote sensing technologies for more accurate pollutant detection and analysis.
- Source identification: Investigate and quantify pollutant sources, including industrial emissions and conflict-related activities, to better understand their contributions.
- Health correlation research: Study the relationship between pollutant levels and public health outcomes, providing insights for targeted interventions.
- Comparative and predictive analysis: Conduct regional comparative studies and develop predictive models to assess and anticipate the environmental impacts of future disruptions or conflicts.
The study’s analysis of Aerosol Optical Depth (AOD), carbon monoxide (CO), nitrogen dioxide (NO2), and sulfur dioxide (SO2) before and after the war in Khartoum reveals significant changes in air quality due to conflict-related disruptions. AOD values increased substantially post-war, highlighting elevated aerosol concentrations from infrastructure damage, fires, and weakened industrial oversight. In contrast, CO levels declined overall due to reduced industrial and transportation activities, with localized anomalies indicating concentrated emissions. Similarly, NO2 levels fell broadly, reflecting diminished vehicular emissions, with sporadic rises linked to generators. SO2 trends showed reduced mean levels but higher variability, marking sporadic pollution events. These findings underscore the profound environmental impact of socio-political upheavals, with critical implications for public health and urban planning.
- Hryhorczuk D, Levy BS, Prodanchuk M, Kravchuk O, Bubalo N, Hryhorczuk A, et al. The environmental health impacts of Russia’s war on Ukraine. J Occup Med Toxicol. 2024;19(1):1. Available from: https://occup-med.biomedcentral.com/articles/10.1186/s12995-023-00398-y
- Zalakeviciute R, Mejia D, Alvarez H, Bermeo X, Bonilla-Bedoya S, Rybarczyk Y, et al. War impact on air quality in Ukraine. Sustainability. 2022;14(21):13832. Available from: https://doi.org/10.3390/su142113832
- Abed Al Ahad M, Sullivan F, Demšar U, Melhem M, Kulu H. The effect of air-pollution and weather exposure on mortality and hospital admission and implications for further research: A systematic scoping review. PLoS One. 2020;15(10):e0241415. Available from: https://doi.org/10.1371/journal.pone.0241415
- Kazi Z, Filip S, Kazi L. Predicting PM2.5, PM10, SO2, NO2, NO and CO air pollutant values with linear regression in R language. Appl Sci. 2023;13(6):3617. Available from: https://doi.org/10.3390/app13063617
- Meo SA, Salih MA, Al-Hussain F, Alkhalifah JM, Meo AS, Akram A. Environmental pollutants PM2.5, PM10, carbon monoxide (CO), nitrogen dioxide (NO). Eur Rev Med Pharmacol Sci. 2024;28:789-96. Available from: https://doi.org/10.26355/eurrev_202401_35079
- Huang X. The impact of PM10 and other airborne particulate matter on the cardiopulmonary and respiratory systems of sports personnel under atmospheric exposure. Atmosphere. 2023;14(11):1697. Available from: https://doi.org/10.3390/atmos14111697
- Anwer HA, Hassan A. Air quality dynamics in Sichuan Province: Sentinel-5P data insights (2019-2023). Ann Civil Environ Eng. 2024;8(1):057-62. Available from: https://doi.org/10.29328/journal.acee.1001068
- Glenn BE, Espira LM, Larson MC, Larson PS. Ambient air pollution and non-communicable respiratory illness in sub-Saharan Africa: a systematic review of the literature. Environ Health. 2022;21(1):40. Available from: https://ehjournal.biomedcentral.com/articles/10.1186/s12940-022-00852-0
- Kwon SB, Jeong W, Park D, Kim KT, Cho KH. A multivariate study for characterizing particulate matter (PM10, PM2.5, and PM1) in Seoul metropolitan subway stations, Korea. J Hazard Mater. 2015;297:295-303. Available from: https://doi.org/10.1016/j.jhazmat.2015.05.015
- Mannucci PM, Franchini M. Health effects of ambient air pollution in developing countries. Int J Environ Res Public Health. 2017;14(9):1048. Available from: https://doi.org/10.3390/ijerph14091048
- Xiao K, Wang Y, Wu G, Fu B, Zhu Y. Spatiotemporal characteristics of air pollutants (PM10, PM2.5, SO2, NO2, O3, and CO) in the inland basin city of Chengdu, southwest China. Atmosphere. 2018;9(2):74. Available from: https://doi.org/10.3390/atmos9020074
- Manisalidis I, Stavropoulou E, Stavropoulos A, Bezirtzoglou E. Environmental and health impacts of air pollution: a review. Front Public Health. 2020;8:14. Available from: https://doi.org/10.3389/fpubh.2020.00014
- Pandey SK, Singh J. Nitrogen dioxide: Risk assessment, environmental, and health hazard. In: Hazardous Gases. Academic Press; 2021:273-288. Available from: https://doi.org/10.1016/b978-0-323-89857-7.00001-3
- Ogen Y. Assessing nitrogen dioxide (NO2) levels as a contributing factor to coronavirus (COVID-19) fatality. Sci Total Environ. 2020;726:138605. Available from: https://doi.org/10.1016/j.scitotenv.2020.138605
- Abed Al Ahad M, Sullivan F, Demšar U, Melhem M, Kulu H. The effect of air-pollution and weather exposure on mortality and hospital admission and implications for further research: A systematic scoping review. PLoS One. 2020;15(10):e0241415. Available from: https://doi.org/10.1371/journal.pone.0241415
- Okello NO, Camminga S, Okello TW, Zunckel M. Spatial and temporal trends of PM₁₀ and SO2 in the Richards Bay area. Clean Air J. 2018;28(2):80-89. Available from: http://dx.doi.org/10.17159/2410-972X/2018/v28n2a20
- Abed Al Ahad M, Sullivan F, Demšar U, Melhem M, Kulu H. The effect of air-pollution and weather exposure on mortality and hospital admission and implications for further research: A systematic scoping review. PLoS One. 2020;15(10):e0241415. Available from: https://doi.org/10.1371/journal.pone.0241415
- Yuan Z, De La Cruz LK, Yang X, Wang B. Carbon monoxide signaling: examining its engagement with various molecular targets in the context of binding affinity, concentration, and biologic response. Pharmacol Rev. 2022;74(3):825-875. Available from: https://doi.org/10.1124/pharmrev.121.000564
- Polichetti G, Cocco S, Spinali A, Trimarco V, Nunziata A. Effects of particulate matter (PM10, PM2.5, and PM1) on the cardiovascular system. Toxicology. 2009;261(1-2):1-8. Available from: https://doi.org/10.1016/j.tox.2009.04.035
- Thangavel P, Park D, Lee YC. Recent insights into particulate matter (PM2.5)-mediated toxicity in humans: an overview. Int J Environ Res Public Health. 2022;19(12):7511. Available from: https://doi.org/10.3390/ijerph19127511
- Chen R, Hu B, Liu Y, Xu J, Yang G, Xu D, Chen C. Beyond PM2.5: The role of ultrafine particles on adverse health effects of air pollution. Biochim Biophys Acta. 2016 Dec;1860(12):2844-55. Available from: https://doi.org/10.1016/j.bbagen.2016.03.019
- Grippo A, Zhang J, Chu L, Guo Y, Qiao L, Zhang J, et al. Air pollution exposure during pregnancy and spontaneous abortion and stillbirth. Rev Environ Health. 2018;33(3):247-264. Available from: https://doi.org/10.1515/reveh-2017-0033
- Saldiva PHN, Santée K, Fajerstzjan L, Veras MM. Air pollution and DOHaD: The health of the next generation with emphasis on the Brazilian population. Curr Opin Toxicol. 2023;35:100416. Available from: http://dx.doi.org/10.1016/j.cotox.2023.100416
- Izah SC, Ogwu MC, Etim NG, Shahsavani A, Namvar Z. Short-term health effects of air pollution.
- Rosmiati M, Rizal MF, Susanti F, Alfisyahrin GF. Air pollution monitoring system using LoRa modul as transceiver system. TELKOMNIKA (Telecommunication Computing Electronics and Control). 2019;17(2):586-592. Available from: http://dx.doi.org/10.12928/telkomnika.v17i2.11760
- Javaid A, Abbas SH. Comprehensive Assessment of Air Quality Dynamics Around Yosemite National Park Using Remote Sensing, GIS, and Computational Analysis During Wildfire Events. Available from: https://journal.50sea.com/index.php/IJIST/article/view/967
- Sarsenova Z, Yedilkhan D, Yermekov A, Saleshova S, Amirgaliyev B. Analysis and assessment of air quality in Astana: Comparison of pollutant levels and their impact on health. Sci J Astana IT Univ. 2024:98-117. Available from: https://journal.astanait.edu.kz/index.php/ojs/article/view/627
- Amaya DP, Samuel S. Assessment of the impact of vehicle emissions on air quality changes during COVID-19 lockdown in Bogota, Colombia. SAE Technical Paper. 2022:2022-01-0583. Available from: https://doi.org/10.4271/2022-01-0583
- Sharma M, Singh K, Gautam AS, Gautam S. Longitudinal study of air pollutants in Indian metropolises: Seasonal patterns and urban variability. Aerosol Sci Eng. 2024:1-16. Available from: http://dx.doi.org/10.1007/s41810-024-00262-4
- Mustamin SB, Atnang M, Sahriani S, Fajar N, Sari SK, Pahlawan MR, Amrullah M. Smart sensors and intelligent analysis: A literature review on more effective early warning systems with IoT and machine learning. J Sci Insights. 2024;1(4):143-154. Available from: https://journal.scitechgrup.com/index.php/jsi/article/view/182
- Fahim MAS, Visockienė JS. Air pollution sources and their impact on the environment. Mokslas–Lietuvos Ateitis. Aplinkos Inžinerija. 2024;16:1-8. Available from: https://doi.org/10.3846/mla.2024.21293
- Kou Y, Du S, Du W, Yang Y, Qin L. Exposure to air pollution and non-neoplastic digestive system diseases: Findings from The China Health and Retirement Longitudinal Study. Front Public Health. 2024;12:1372156. Available from: https://doi.org/10.3389/fpubh.2024.1372156
- Mohamed T. The prediction of flood monitoring for image satellite using artificial neural networks. J Karary Univ Eng Sci. 2024.
- Hassan A. Analyzing the results of Erdas Imagine 16.7.0 and ArcGIS Pro 3.0.3 in the process of creating land cover maps using Landsat 8 data. J Karary Univ Eng Sci. 2024.

