More Information
Submitted: August 24, 2024 | Approved: August 28, 2024 | Published: August 29, 2024
How to cite this article: Machano JM, Mohamed AAJ, Bakar SS. Quantifying Levels of Selected Metals in Different Rice Brands. Ann Civil Environ Eng. 2024; 8(1): 070-075. Available from: https://dx.doi.org/10.29328/journal.acee.1001070
DOI: 10.29328/journal.acee.1001070
Copyright License: © 2024 Machano JM, et al. This is an open access article distributed under the Creative Commons Attribution License, which permits unrestricted use, distribution, and reproduction in any medium, provided the original work is properly cited.
Keywords: Hafnium; Lead; Titanium; Mapembe; Basmati; Cheju
Quantifying Levels of Selected Metals in Different Rice Brands
Jamila M Machano, Abdul AJ Mohamed* and Said S Bakar
Department of Natural Science, School of Natural and Social Sciences, The State University of Zanzibar, PO. Box 146, Zanzibar, Tanzania
*Address for Correspondence: Abdul AJ Mohamed, Department of Natural Science, School of Natural and Social Sciences, The State University of Zanzibar, PO. Box 146, Zanzibar, Tanzania, Email: [email protected]
This research focused on assessing the levels of selected metal contamination in seven different rice brands (Jasmine, Basmati, Mapembe, Morogoro, Shinyanga, Mbeya, and Cheju). Cheju rice was obtained from local producers from the Cheju area in Zanzibar, while the remaining rice brands namely, Jasmine, Basmati, Mapembe, Morogoro, Shinyanga, and Mbeya were randomly taken from local markets at Darajani and Mwanakwerekwe in Zanzibar. Samples were prepared in accordance with applicable Safe Operating Procedures (SOPs) and laboratory SOPs using information provided by field sample preparation. The samples were ground to fineness and an aliquot of about 10.0 g was measured on the beam balance and mounted on the sample holders for laboratory analysis. An Energy Dispersive X-Ray Fluorescence (EDXRF) technique with a Rigaku NEX CG EDXRF model spectrometer was used for metal analysis. The study revealed that the percentage of metal contamination varied considerably from one rice brand to another, with Basmati and Jasmine rice each exhibiting a contamination level of 50%, while Shinyanga, Mbeya, Mapembe, and Cheju rice showed a level of 25% each. Notably, Morogoro rice had no observable heavy metal contamination. Additionally, a significant positive correlation was observed between several metal pairs: Au and Cr (r² = 1.00), Au and Ti (r² = 0.613), Cr and Ti (r² = 0.613), Ni and Pb (r² = 0.748), Ni and Hf (r² = 0.660), Pb and Hf (r² = 0.656), and Ti and Sn (r² = 0.671). The individual occurrence (percentage) for metals across all rice brands were as follows: 71.42% for Sn, and 28.57% for Hf, Ni, Pb, and Ti, while traces of Au, Cr, and Y each had an occurrence level of 14.28%. While Morogoro rice showed no metal discernible analyzed heavy metal contamination, the other rice brands were observed to have a considerable heavy metal contamination trend. The patterns of metal occurrence in each rice brand were observed as follows: Basmati: Sn > Ti > Au > Cr; Jasmine: Sn > Hf > Ni > Pb; Shinyanga: Sn > Pb; Mbeya: Sn > Hf; Mapembe: Sn > Ti; Cheju: Ni > Y. The patterns, then yield the ranking of metal contamination across all seven rice brands from lowest to highest is as follows: Morogoro < (Mapembe, Cheju, Mbeya, Shinyanga) < (Jasmine, Basmati). Furthermore, the data analysis indicated that the concentrations of Cr (1.08 mg/Kg), Ni (4.65 mg/Kg), and Pb (3.05 mg/Kg) detected in the samples surpassed the maximum permissible limits established by WHO/FAO which were 1.0 mg/Kg, 0.10 mg/Kg and 0.20 mg/Kg respectively. Consequently, the study concludes that Morogoro rice is the most superior and considered the safest choice for consumption, while Jasmine and Basmati rice are associated with higher levels of metal contamination. Thus, it is highly recommended that Tanzania intensify its rice cultivation efforts to reduce reliance on rice imports from other nations.
Food safety is of great concern for human health as well as their well-being [1]. Rice is the most famous food worldwide. More than 100 countries cultivate rice, and Asia is the leading producer [2]. Some countries cultivate rice in large quantities which allows them to export it to other countries where cultivation is insufficient to demands. About three billion people in the world consume rice as their staple food [3].
Rice is one of the essential foods as it contains different nutrients and minerals. However, the application of pesticides, improper disposal of waste material, and distinctive deposition can cause metal pollution. Growing food crops on polluted soil causes metal toxicity in food crops [4,5]. Approximately, 235 million hectares worldwide have already been contaminated with heavy metals [6]. Ingesting heavy metal-contaminated rice for an extended period of time can pose a public health risk which can be estimated by food safety assessment [7]. The toxicity, bioaccumulation, and potential toxic effects of heavy metal (loid)s may pose significant risks to human health globally [8]. Table 1 gives a summary of some implications of heavy metal contamination and public health concerns.
| Table 1: Heavy Metal Implications and Public Health Concerns | |
| Metal | Some Possible Effects on Human being |
|
Chromium (Cr) |
Increases enzyme activity [17]. Promotes carbohydrate metabolism, fatty acid, and cholesterol synthesis from acetate in the liver [17]. Activates insulin, and hence regulates sugar metabolism [17]. |
|
Lead (Pb) |
Contributes to brain damage [18-20]. Causes anaemia, miscarriages in pregnant women, and deaths in newborns Leads to disorders of body parts [19,21]. Disrupts short-term memory and reduces intelligence [22,23]. |
| Nickel (Ni) |
Promotes the absorption of ferric iron [24]. Causes hematotoxicity, immunotoxicity, genotoxicity, and carcinogenicity in humans [25]. |
Heavy metal contamination in soil has different sources, some of them include industrial wastes, continuous application of agrochemicals such as fertilizers, pesticides, and herbicides, farm animals’ growth promoters, sewage sludge, and animal manure [9-11].
Accumulation of heavy metals endangers environmental sustainability and human health as well. Heavy metals are carcinogenic in nature and they are capable of causing multiple organ damage [12].
According to Tumolo, et al. 2020 [13], chromium (Cr) can lead to respiratory disorders, damage the liver and kidney, and cause internal hemorrhage.
A study done by Kumar, et al. 2020 [14] has clarified that lead (Pb) is one of the hazardous metals. It can cause disruption of the nervous for children specifically during the prenatal stage of their childhood [15]. It also affects hearing capacity, cognitive development, delayed puberty, kidney damage, and cardiovascular and central nervous system impairment.
Nickel also can expose effects on human health, some of the effects caused by nickel include lung and nasal cancer, vesicular eczema, and damage to the brain, liver, spleen, and other tissues [16].
Gold (Au), Titanium (Ti), Hafnium (Hf), and Ytterium (Y) were hardly found their information in previous reviews. Hence, it is essential for researchers to find out the effects of these minerals since they are among the components of rice nowadays and people consume them.
A collection of 18 rice samples was gathered from seven distinct brands: Jasmine, Basmati, Mapembe, Mbeya (from Shinyanga and Morogoro), and Cheju. Basmati, Jasmine, and Mapembe are sourced from India, Vietnam, and Pakistan, respectively. The rice from Mbeya, Morogoro, and Shinyanga, known as the MBEYA brand, is imported from Tanzania's mainland, while Cheju rice is cultivated locally in Zanzibar.
In February 2024, approximately one kilogram of each rice brand was collected. Cheju rice was sourced from local farmers in Cheju, while Jasmine, Basmati, and Mapembe varieties were collected from the Darajani market. Rice from Mbeya (Shinyanga and Morogoro regions) was acquired at the Mwanakwerekwe market in Zanzibar. The samples were individually stored in polyethylene bags prior to the laboratory for analysis in March 2024.
Upon arrival at the laboratory, the samples were ground into a fine powder, and approximately 10.0 grams of each sample was weighed using a beam balance and placed in sample holders for examination. The analysis was conducted using an Energy Dispersive X-Ray Fluorescence (EDXRF) spectrometer, specifically The Rigaku NEX CG model, which is designed for elemental analysis ranging from sodium to uranium in various forms including solids, liquids, powders, and thin film coatings on solid surfaces. An ED-XRF spectrometer essentially consists of an X-ray source, a sample holder, and a Si (Li) detector orientated at 90 degrees to the primary radiation. An important limitation of this technique is its relatively low resolving power of the solid-state detectors. This disadvantage results in considerable peak overlap in ED- XRF spectra, making reliable quantitative processing of the raw data not straightforward. By employing suitable data evaluation software (fitting the experimental spectra to mathematical models), this disadvantage can almost completely be eliminated.
These fluorescent X-rays are detected and quantified by a multi-channel analyzer. The NEX CG software then computes the concentration of each detected element.
Descriptive Statistics and ANOVA Results
Using SPSS version 20, descriptive statistics were done to analyze various factors including maximum concentrations of each detected metal in all analyzed rice brands. One-way ANOVA also was used to find the correlation between the metals. Table 2 displays the maximum concentrations of various analyzed metals across different brands of rice.
Table 2: Pre- and post-measurement used for spectroscopic imaging of stones.
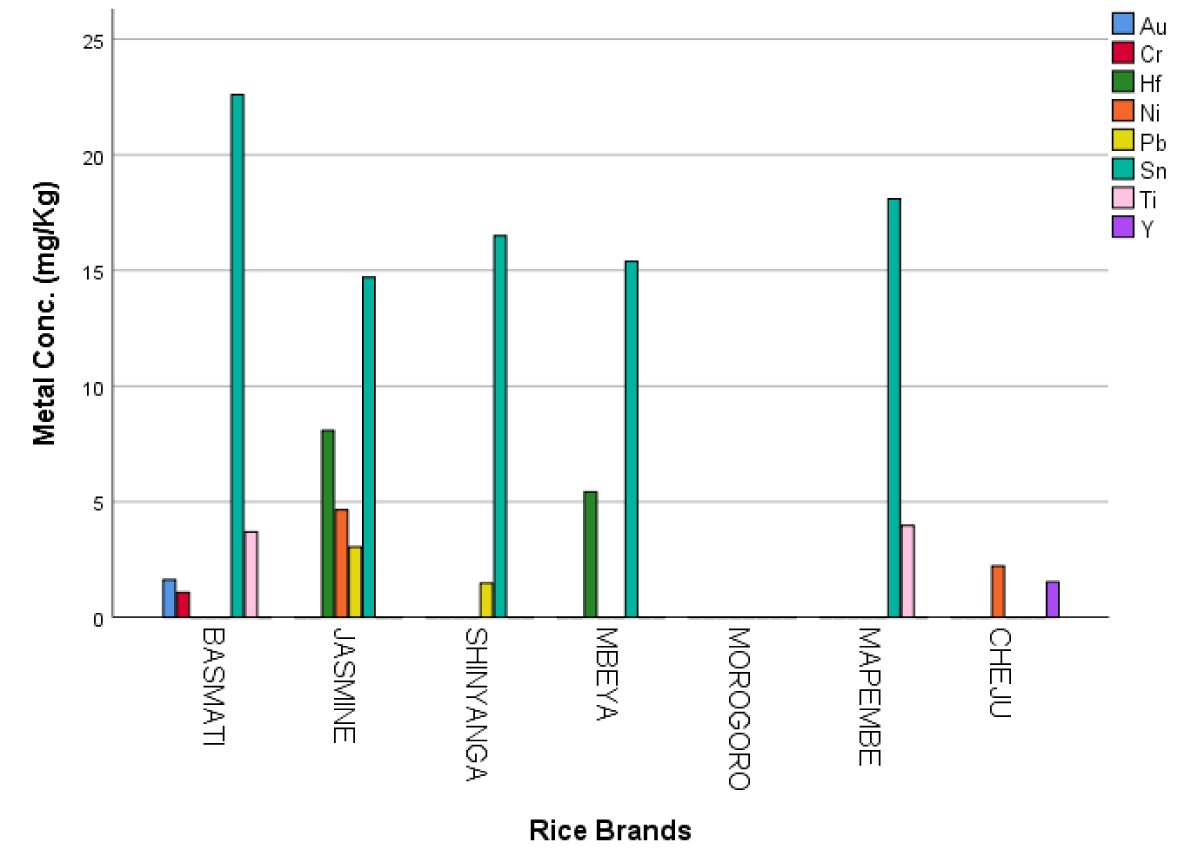
The data indicates that Sn was present in all brands except for Morogoro and Cheju rice. Other metals were detected in only a limited number of brands. Specifically, Au and Cr were exclusively found in Basmati rice, while Y was solely identified in Cheju rice. Ni was present in both Jasmine and Cheju rice, Pb was detected in Jasmine and Shinyanga rice, Ti was found in Basmati and Mapembe rice, and Hf was observed in Jasmine and Mbeya rice. This information is also visually represented in Figure 1.
Figure 1: Maximum Concentration of Metals in Rice.
In addition to the aforementioned determinants, a comprehensive statistical analysis was conducted to assess the correlation between the various analyzed metals. This thorough examination aimed to uncover any significant relationships present within the data set, offering deeper insights into the interactions between these metallic elements. The findings of this detailed analysis have been systematically compiled and are presented in Table 3, which summarizes the results in a clear and organized format. This table not only illustrates the correlation coefficients but also provides a concise overview of the statistical significance of each relationship investigated, thereby contributing to a more nuanced understanding of the dynamics among the metals studied.
Table 3 reveals that certain metals in this study displayed significant positive correlations with one another. For instance, the correlation between Au and Cr was perfect (r = 1.00), while Au also showed a correlation of 0.613 with Ti. Similarly, Cr and Ti shared a correlation of 0.613. Moreover, Ni exhibited a strong correlation with Pb (r = 0.748) and Hf (r = 0.660), while the relationship between Pb and Hf was close as well (r = 0.656). Finally, Ti and Sn demonstrated a correlation of 0.671.
| Table 3: Correlation Matrix of Metals Found in Analyzed Rice. | ||||||||
| Element | Au | Cr | Ni | Pb | Ti | Y | Hf | Sn |
| Au | 1 | 1.000** | -0.238 | -0.239 | 0.613* | -0.167 | -0.251 | 0.329 |
| Cr | 1 | -0.238 | -0.239 | 0.613* | -0.167 | -0.251 | 0.329 | |
| Ni | 1 | 0.748* | -0.369 | 0.301 | 0.660* | -0.201 | ||
| Pb | 1 | -0.370 | -0.239 | 0.656* | 0.158 | |||
| Ti | 1 | -0.258 | -0.389 | 0.671* | ||||
| Y | 1 | -0.251 | -0.605 | |||||
| Hf | 1 | 0.133 | ||||||
| Sn | 1 | |||||||
Critical Analysis of Metals in Analyzed Rice Brands
This section gives in-depth information on the concentration of the detected metals in each brand of rice as obtained from the descriptive analysis results.
Gold (Au) and Chromium (Cr) Concentrations in Rice Brands
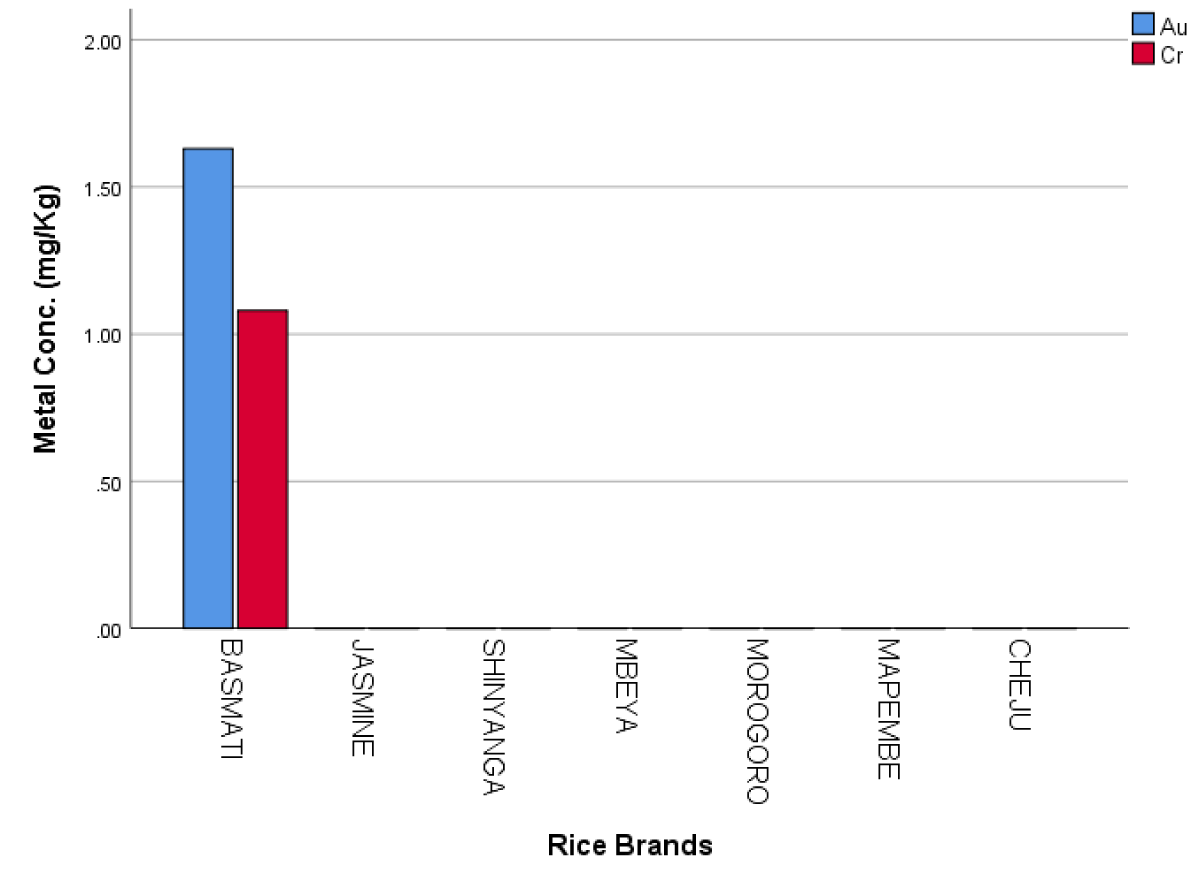
From the analysis, it was found that Au and Cr are only present in Basmati rice with noted concentrations of 1.63 and 1.08 mg/kg, respectively (Table 2). These concentrations were plotted in the graph as shown in Figure 2.
Figure 2: Concentration of Au and Cr in Rice Brands.
Nickel (Ni) Concentration in Analyzed Rice Brands
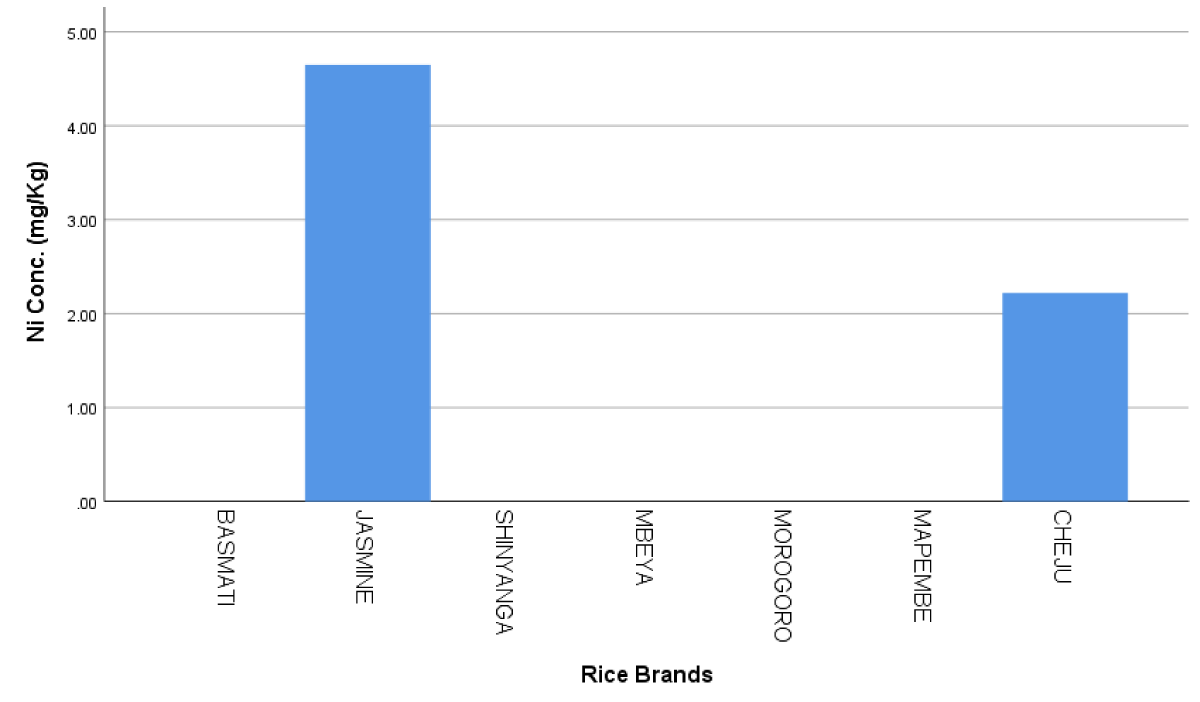
Ni was detected in Jasmine and Cheju rice. In Jasmine rice, the concentration of Ni was 4.65 mg/Kg while in Cheju rice it was 2.22 mg/Kg (Table 2). Figure 3 indicates the concentration of this metal in detected rice.
Figure 3: Ni Concentration in Brands of Rice.
Lead (Pb) Concentration in Rice Brands
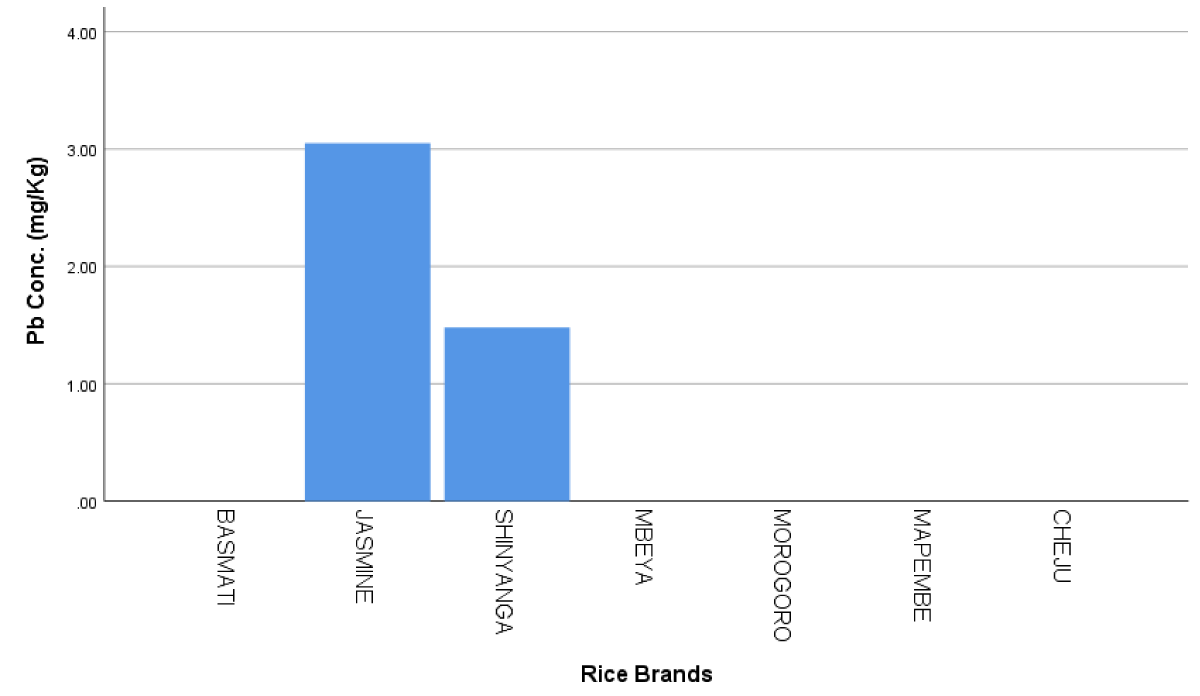
Lead was found in Jasmine and Shinyanga rice with concentrations of 3.05 and 1.48 mg/Kg respectively (Table 2). Figure 4 explores this concentration graphically.
Figure 4: Pb Concentration in Analyzed Rice Brands.
Concentration of Titanium (Ti) in Rice Brands
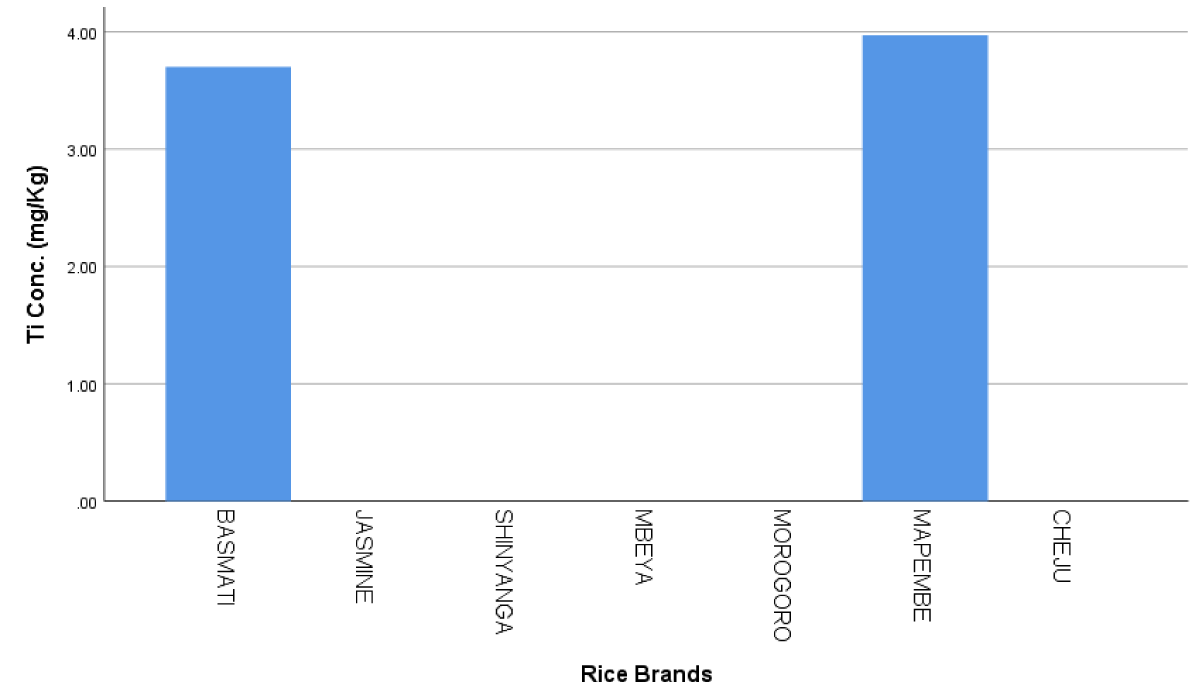
This metal was detected in two rice brands; Basmati and Mapembe. In Basmati rice its concentration was 3.7 mg/Kg whereas in Mapembe it was 3.97 mg/Kg. Graphic illustration for these metals is explored in Figure 5.
Figure 5: Concentration of Ti in Rice Brands.
Yttrium (Y) Concentration in Analyzed Rice
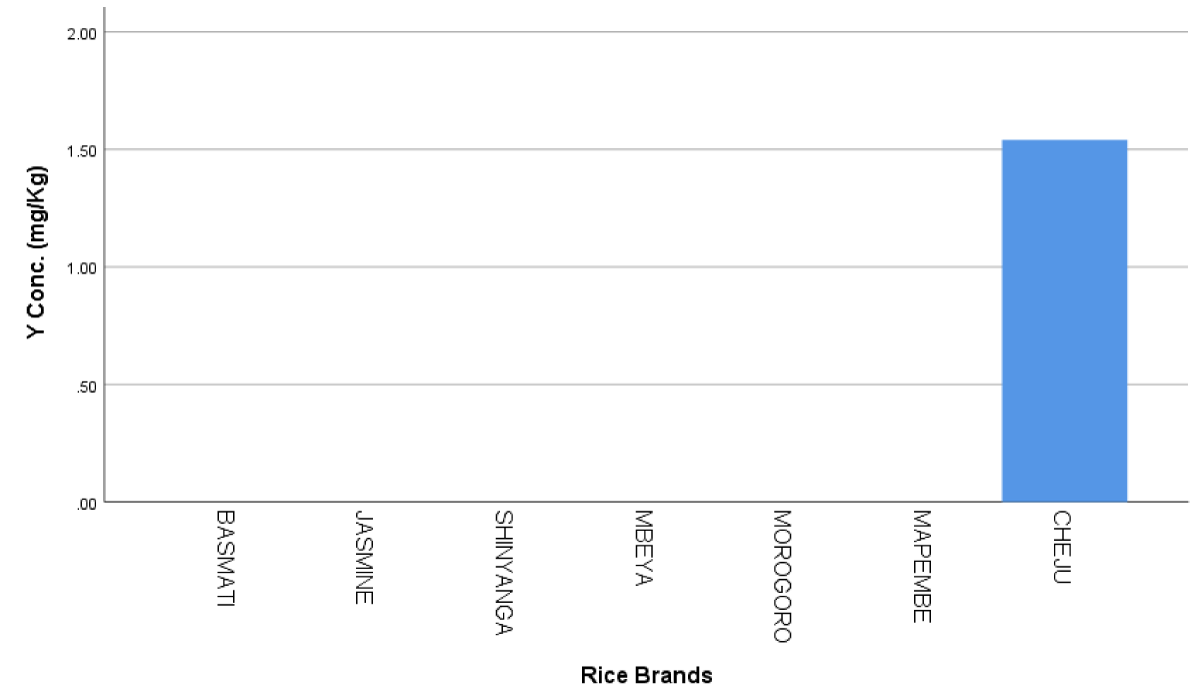
The metal Y was only detected in Cheju rice with a concentration of 1.54 mg/Kg (Table 2). It was then explored in graphic form as shown in Figure 6. Hafnium (Hf) Concentration in Rice Brands.
Figure 6: Concentration of Y in Rice Brandss.
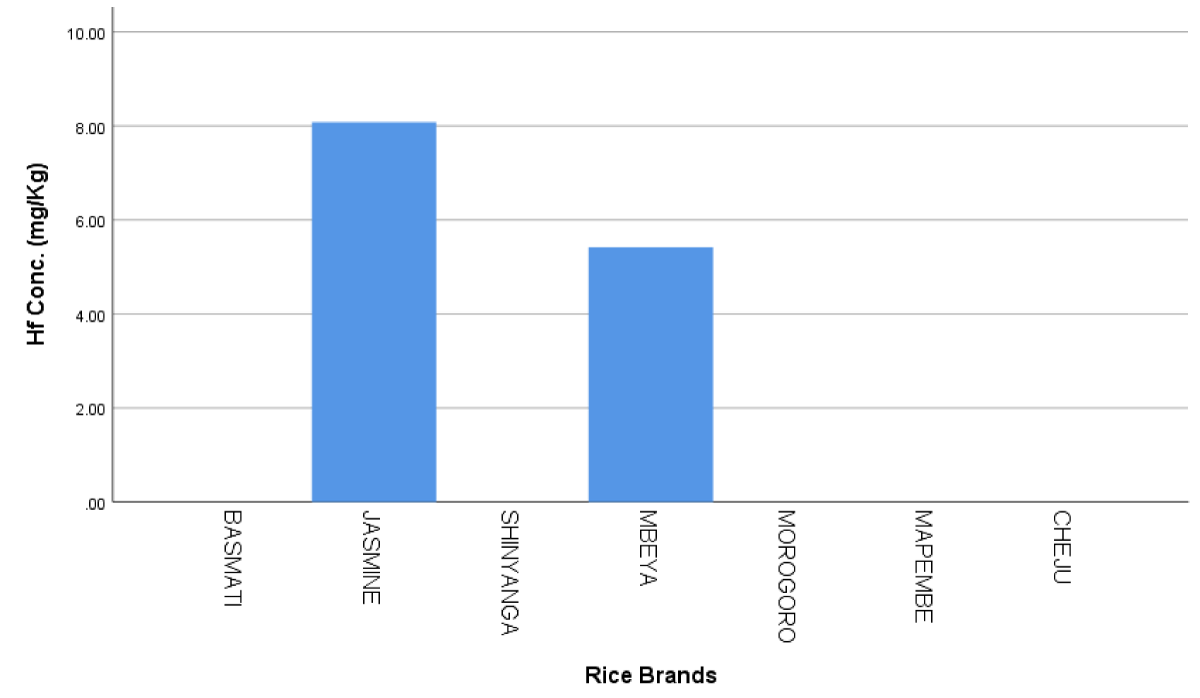
Jasmine and Mbeya rice were found to contain Hf in concentrations of 8.08 and 5.42 mg/Kg in corresponding order (Table 2). This was then translated in graphical form and the Figure 7 was illustrated.
Figure 7: Concentration of Hf in Rice Brands.
Tin (Sn) Concentration in Analyzed Rice
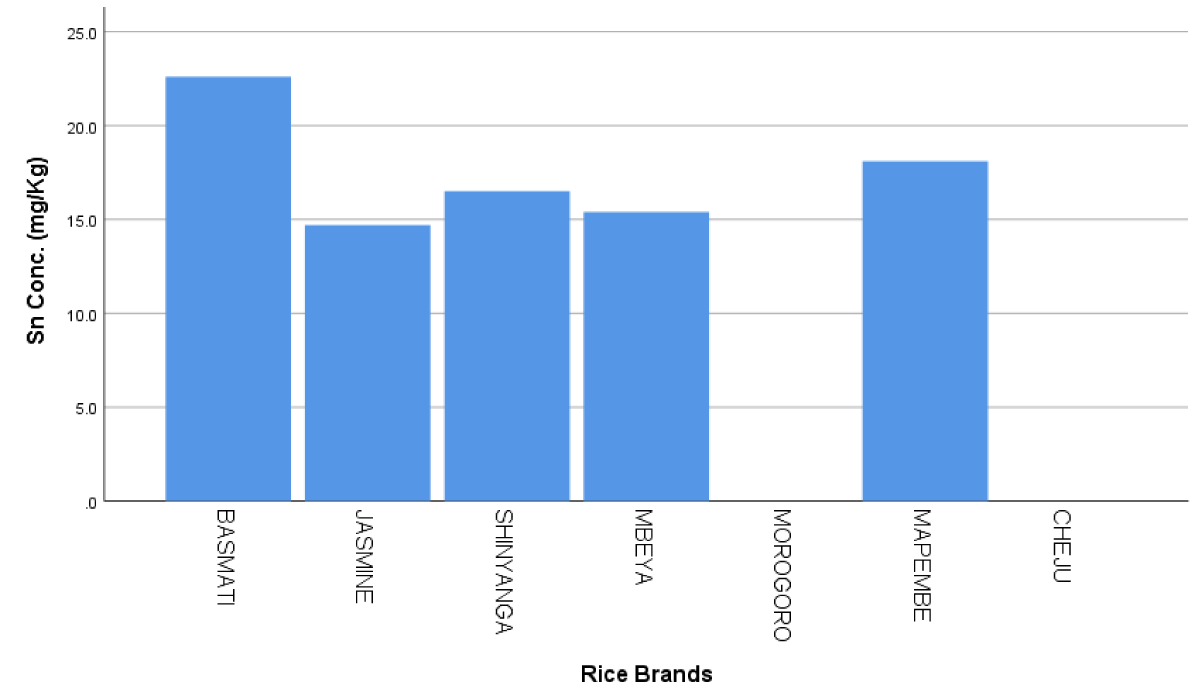
Tin was detected in five analyzed brands of rice out of seven. The concentration of this metal in mg/Kg for each brand of rice was as follows: Basmati (22.6), Jasmine (14.7), Shinyanga (16.5), Mbeya (15.4), and Mapembe (18.1). In Morogoro and Cheju rice, the metal was Below Detection Limit (Table 2). Figure 8 illustrates the concentration of this metal.
Figure 8: Sn Concentration in Brands of Rice.
Chronological Order of Metals Levels in Analyzed Rice
Jasmine and Basmati rice were discovered to contain four different metals, while other brands such as Mapembe, Mbeya, Shinyanga, and Cheju rice had only two metals each. Notably, Morogoro rice showed no presence of any of the metals analyzed. Among the five rice brands tested, tin was identified as the metal with the highest concentration across the board. A comprehensive overview of the metals detected in the analyzed rice brands can be found in Table 4.
| : Trend of Metals in Analyzed Rice | ||
| Rice Brand | Trend of Analyzed Metals | Element Below the Detection Limit (BDL) |
| Jasmine | Sn > Hf > Ni > Pb | Au, Cr, Ti, and Y |
| Basmati | Sn > Ti > Au > Cr | Ni, Pb, Hf, and Y |
| Mapembe | Sn > Ti | Au, Cr, Ni, Pb, Hf, and Y |
| Mbeya | Sn > Hf | Au, Cr, Ni, Ti, Pb, and Y |
| Shinyanga (Mbeya) | Sn > Pb | Au, Cr, Ti, Hf, Ni, and Y |
| Morogoro (Mbeya) | BDL | Au, Cr, Ni, Pb, Ti, Hf, Sn, and Y |
| Cheju | Ni > Y | Au, Cr, Pb, Ti, Sn, and Hf |
| BDL: Below Detection Limit | ||
The trend of metal contamination in ascending order is as follows:
Morogoro < (Mapembe, Mbeya, Shinyanga and Cheju) < (Jasmine, Basmati)
Percentage occurrence of detected metals
Regardless of the levels of metals detected in various rice brands, this study also assessed the percentage of contamination and the occurrence level for each metal. Analyzing the occurrence percentages of metals across different rice brands revealed that gold (Au), chromium (Cr), and yttrium (Y) each had an occurrence level of 14.28%. Nickel (Ni), hafnium (Hf), lead (Pb), and titanium (Ti) were found in 28.57% of the samples, while tin (Sn) had a significantly higher occurrence level of 71.42% (Table 5).
| Table 5: Metal Existence in Analyzed Rice | ||||||||
| Metal | Basmati | Jasmine | Shinyanga | Mbeya | Morogoro | Mapembe | Cheju | % Occurrence of Metals |
| Au | √ | ND | ND | ND | ND | ND | ND | 14.28 |
| Cr | √ | ND | ND | ND | ND | ND | ND | 14.28 |
| Ni | ND | √ | ND | ND | ND | ND | √ | 28.57 |
| Pb | ND | √ | √ | ND | ND | ND | ND | 28.57 |
| Ti | √ | ND | ND | ND | ND | √ | ND | 28.57 |
| Y | ND | ND | ND | ND | ND | ND | √ | 14.28 |
| Hf | ND | √ | ND | √ | ND | ND | ND | 28.57 |
| Sn | √ | √ | √ | √ | ND | √ | ND | 71.42 |
| Heavy metal % contamination | 50 | 50 | 25 | 25 | 00 | 25 | 25 | NA |
| Origin | India | Vietnam | Shinyanga | Mbeya | Morogoro | Pakistan | Cheju | NA |
ND: Not Detected |
||||||||
When examining the percentage of metal contamination among the rice brands, Basmati and Jasmine rice showed a contamination level of 50% each. Shinyanga, Mbeya, Mapembe, and Cheju rice displayed a 25% contamination level each, whereas notably, Morogoro rice had a contamination level of 0% (Table 5). This finding suggests that Morogoro rice is the safest option for consumption compared to the other rice brands analyzed.
Comparison with Other Related Studies
In this study, the metals identified were compared to those found in other research concerning their concentrations. It was noted that five out of the eight metals analyzed were not reported in prior studies, with their detection being exclusive to this research. The metals in question include Au, Ti, Y, Hf, and Sn. Furthermore, relevant standards from WHO/FAO for these metals were also absent (Table 6). This observation suggests an increasing prevalence of metal contamination in agricultural areas that were previously deemed uncommon. Consequently, it is crucial for scientists and researchers globally to further explore the presence and potential impacts of these trace elements.
| Table 6: Comparison with Other Related Studies. | |||||||
| Elements | This study | Other Related Studies | WHO/ FAO Std | ||||
| Zanzibar (Cheju) | Tanzania mainland | Imported | Ethiopia [30] | United States [31] | Tanzania[32] | ||
| Au | NF | NF | 1.63 | NF | NF | NF | NF |
| Cr | NF | NF | 1.08 | 4.82 | NF | 6 | 1 |
| Ni | 2.22 | NF | 4.65 | 69.7 | NF | NF | 0.1 |
| Pb | NF | 1.48 | 3.05 | 3.3 | 0.032 | NF | 0.2 |
| Ti | NF | NF | 3.97 | NF | NF | NF | NF |
| Y | 1.54 | NF | NF | NF | NF | NF | NF |
| Hf | NF | 5.42 | 8.08 | NF | NF | NF | NF |
| Sn | NF | 16.5 | 22.6 | NF | NF | NF | 250 |
Remarkably, Morogoro rice showed no detected heavy metal contamination. In other rice brands, heavy metal contamination is found to be at higher levels. The findings indicated that Jasmine rice had the highest concentrations of Ni, Pb, and Hf. These results suggest that rice cultivated in Tanzania is preferable for consumption, as it exhibits lower contamination levels compared to imported varieties. Nevertheless, Jasmine rice demonstrated the highest level of heavy metal contamination. Various factors such as toxic wastes, fertilizer application, herbicide sprays, and various agricultural practices including pesticides and other chemicals could be the sound reason for polluting the food crops. Thus, the metal levels in all frequently consumed food stuffs as well as the soil they are cultivated must be routinely tested, and the risks to human health should be examined.
- Chan M. Food safety must accompany food and nutrition security. Lancet. 2014 Nov 29;384(9958):1910-1. Available from: https://doi.org/10.1016/s0140-6736(14)62037-7
- Fukagawa NK, Ziska LH. Rice: Importance for Global Nutrition. J Nutr Sci Vitaminol (Tokyo). 2019;65(Supplement):S2-S3. doi: 10.3177/jnsv.65.S2. PMID: 31619630. Available from: https://doi.org/10.3177/jnsv.65.s2
- Mosleh MK, Hassan QK, Chowdhury EH. Application of remote sensors in mapping rice area and forecasting its production: a review. Sensors (Basel). 2015 Jan 5;15(1):769-91. Available from: https://doi.org/10.3390/s150100769
- Saleem MH, Ali S, Seleiman MF, Rizwan M, Rehman M, Akram NA, et al. Assessing the Correlations between Different Traits in Copper-Sensitive and Copper-Resistant Varieties of Jute (Corchorus capsularis L.). Plants (Basel). 2019 Nov 26;8(12):545. Available from: https://doi.org/10.3390/plants8120545
- Saleem MH, Fahad S, Rehman M, Saud S, Jamal Y, Khan S, et al. Morpho-physiological traits, biochemical response and phytoextraction potential of short-term copper stress on kenaf (Hibiscus cannabinus L.) seedlings. PeerJ. 2020 Jan 30;8:e8321. Available from: https://doi.org/10.7717/peerj.8321
- Cong W, Miao Y, Xu L, Zhang Y, Yuan C, Wang J, et al. Transgenerational memory of gene expression changes induced by heavy metal stress in rice (Oryza sativa L.). BMC Plant Biol. 2019 Jun 27;19(1):282. Available from: https://doi.org/10.1186/s12870-019-1887-7
- Wei R, Chen C, Kou M, Liu Z, Wang Z, Cai J, et al. Heavy metal concentrations in ricethat meet safety standards can still pose a risk to human health. Communications earth & environment. 2023: 4(84), 723-727.
- Fuller R, Landrigan PJ, Balakrishnan K, Bathan G, Bose-O'Reilly S, Brauer M, et al. Pollution and health: a progress update. Lancet Planet Health. 2022 Jun;6(6):e535-e547. doi: 10.1016/S2542-5196(22)00090-0. Epub 2022 May 18. Erratum in: Lancet Planet Health. 2022 Jul;6(7):e553. Available from: https://doi.org/10.1016/s2542-5196(22)00090-0
- Garbinski LD, Rosen BP, Chen J. Pathways of arsenic uptake and efflux. Environ Int. 2019 May;126:585-597. doi: 10.1016/j.envint.2019.02.058. Epub 2019 Mar 8. PMID: 30852446; PMCID: PMC6472914. Available from: https://doi.org/10.1016/j.envint.2019.02.058
- Zhao K, Fu W, Ye Z, Zhang C. Contamination and spatial variation of heavy metals in the soil-rice system in Nanxun County, Southeastern China. Int J Environ Res Public Health. 2015 Jan 28;12(2):1577-94. Available from: https://doi.org/10.3390/ijerph120201577
- Chamannejadian A, Sayyad G, Moezzi A, Jahangiri A. Evaluation of estimated daily intake (EDI) of cadmium and lead for rice (Oryza sativa L.) in calcareous soils. Iranian J Environ Health Sci Eng. 2013 Apr 8;10(1):28. Available from: https://doi.org/10.1186/1735-2746-10-28
- Tchounwou PB, Yedjou CG, Patlolla AK, Sutton DJ.Heavy Metals Toxicity and the Environment. EXS, 2012:101, 133–164.
- Tumolo M, Ancona V, De Paola D, Losacco D, Campanale C, Massarelli C, et al. Chromium Pollution in European Water, Sources, Health Risk, and Remediation Strategies: An Overview. Int J Environ Res Public Health. 2020 Jul 28;17(15):5438. Available from: https://doi.org/10.3390/ijerph17155438
- Kumar A, Kumar A, M M S CP, Chaturvedi AK, Shabnam AA, et al. Lead Toxicity: Health Hazards, Influence on Food Chain, and Sustainable Remediation Approaches. Int J Environ Res Public Health. 2020 Mar 25;17(7):2179. Available from: https://doi.org/10.3390/ijerph17072179
- Mason LH, Harp JP, Han DY. Pb neurotoxicity: neuropsychological effects of lead toxicity. Biomed Res Int. 2014;2014:840547. Available from: https://doi.org/10.1155/2014/840547
- Poonkothai M, Vijayavathi S. Nickel as an essential element and a toxicant, International Journal of Engineering, Science and Technology. 2012: 1(4), 285-288.
- Falah SA, Saja NM. Essential Trace Elements and Their Vital Roles in Human Body. Indian Journal of Advances in Chemical Science. 2017: 5(3), 127-136. Available online at www.ijacskros.com. (in table)
- Widowati S. Karakteristik Beras Instan Fungsional dan Peranannya dalam Menghambat Kerusakan Pankreas. Jurnal Pangan Edisi No. 52/XVII/Oktober-Desember/2008.
- Ok YS, Usman AR, Lee SS, Abd El-Azeem SA, Choi B, Hashimoto Y, Yang JE. Effects of rapeseed residue on lead and cadmium availability and uptake by rice plants in heavy metal contaminated paddy soil. Chemosphere. 2011 Oct;85(4):677-82. Available from: https://doi.org/10.1016/j.chemosphere.2011.06.073
- Ashraf U, Hussain S, Anjum SA, Abbas F, Tanveer M, Noor MA, et al. Alterations in growth, oxidative damage, and metal uptake of five aromatic rice cultivars under lead toxicity. Plant Physiol Biochem. 2017 Jun;115:461-471. Available from: https://doi.org/10.1016/j.plaphy.2017.04.019
- Zulkafflee NS, Mohd Redzuan NA, Hanafi Z, Selamat J, Ismail MR, Praveena SM, et al. Heavy Metal in Paddy Soil and its Bioavailability in Rice Using In Vitro Digestion Model for Health Risk Assessment. Int J Environ Res Public Health. 2019 Nov 28;16(23):4769. Available from: https://doi.org/10.3390/ijerph16234769
- Szkup-Jabłońska M, Karakiewicz B, Grochans E, Jurczak A, Nowak-Starz G, et al. Effects of blood lead and cadmium levels on the functioning of children with behaviour disorders in the family environment. Ann Agric Environ Med. 2012;19(2):241-6. Available from: https://pubmed.ncbi.nlm.nih.gov/22742795/
- Norton GJ, Williams PN, Adomako EE, Price AH, Zhu Y, Zhao FJ, et al. Lead in rice: analysis of baseline lead levels in market and field collected rice grains. Sci Total Environ. 2014 Jul 1;485-486:428-434. Available from: https://doi.org/10.1016/j.scitotenv.2014.03.090
- Goyer R. Issue Paper on the Human Health Effects of Metals. U.S. Environmental Protection Agency. Risk Assessment Forum. Washington, DC. 2004.
- Halder D, Saha JK, Biswas A. Accumulation of essential and non-essential trace elements in rice grain: Possible health impacts on rice consumers in West Bengal, India. Sci Total Environ. 2020 Mar 1;706:135944. Available from: https://doi.org/10.1016/j.scitotenv.2019.135944
- FAO. Report of the 29th session of the codex Alimentarius commission. 2006: Rome; Report No.: ALINORM 06/29/41. http://www.fao.org/tempref/codex/Reports/Alinorm06/al29_03e.pdf
- Hasan GMMA, Das AK, Satter MA. Accumulation of Heavy Metals in Rice (Oryza sativa. L) Grains Cultivated in Three Major Industrial Areas of Bangladesh. J Environ Public Health. 2022 Mar 8;2022:1836597. Available from: https://doi.org/10.1155/2022/1836597
- WHO/FAO. codex alimentarius commission committee on standard programme for contaminants in foods. Fifth session, document CX/CF 07/1/6, 21-25 march, 2011. Available online: http://www.fao.org/tempref/codex/Meetings/CCCF/CCCF5/cf0 5_INF.pdf
- Menghua X, Yuanyuan L. Distribution Characteristics and Ecological Risk Assessment of Heavy Metals under Reclaimed Water Irrigation and Water Level Regulations in Paddy Field. Pol. J. Environ. Stud., 2022: 31(3), 2355-2365.
- Tegegne B, Chandravanshi BS, Zewge F. Levels of selected metals in commercially available rice in Ethiopia. International Food Research Journal. 2017: 24(2), 711-719.
- Tatah Mentan M, Nyachoti S, Scott L, Phan N, Okwori FO, et al. Toxic and Essential Elements in Rice and Other Grains from the United States and Other Countries. Int J Environ Res Public Health. 2020 Nov 3;17(21):8128. Available from: https://doi.org/10.3390/ijerph17218128
- Mohammed NK. Nuclear Techniques Applied to Biological Samples from Tanzania to Monitor the Nutritional Status of Children. Faculty of Engineering and Physical Sciences. University of Surrey. 2008.

