More Information
Submitted: July 23, 2024 | Approved: August 01, 2024 | Published: August 02, 2024
How to cite this article: Anwer HA, Hassan A. Air Quality Dynamics in Sichuan Province: Sentinel-5P Data Insights (2019-2023). Ann Civil Environ Eng. 2024; 8(1): 057-062. Available from: https://dx.doi.org/10.29328/journal.acee.1001068
DOI: 10.29328/journal.acee.1001068
Copyright License: © 2024 Anwer HA, et al. This is an open access article distributed under the Creative Commons Attribution License, which permits unrestricted use, distribution, and reproduction in any medium, provided the original work is properly cited.
Keywords: Air pollution; Industrial pollutants; Vehicle emissions; Particulate matter; Satellite data
Air Quality Dynamics in Sichuan Province: Sentinel-5P Data Insights (2019-2023)
Hossam Aldeen Anwer and Abubakr Hassan*
Department of Surveying Engineering, College of Engineering, Karary University, Sudan
*Address for Correspondence: Abubakr Hassan, Department of Surveying Engineering, College of Engineering, Karary University, Sudan, Email: [email protected]
This study assesses air pollution in Sichuan Province, China, from January 2019 to December 2023 using Copernicus Sentinel-5P satellite data. The analysis reveals distinct seasonal variations in levels of Carbon Monoxide (CO), Nitrogen Dioxide (NO2), Sulfur Dioxide (SO2), and Ozone (O3), with urban areas experiencing higher concentrations due to industrial and vehicular emissions. CO and O3 frequently exceeded WHO guidelines, particularly in winter and summer, indicating significant health risks. While most pollutant levels remained within safety limits, the findings highlight the importance of continuous monitoring and targeted mitigation strategies to improve air quality and safeguard public health, especially in urban environments.
Sichuan Province, located in southwestern China, boasts a rich geographic diversity, from the low-lying Sichuan Basin to the towering Tibetan Plateau. Home to over 83 million residents, its capital city, Chengdu, serves as a significant economic and technological hub [1,2]. However, the province's rapid urbanization and industrialization have led to severe air quality problems, posing major public health concerns. Air pollution in Sichuan is marked by high levels of particulate matter (PM2.5 and PM10), sulfur dioxide (SO2), nitrogen dioxide (NO2), carbon monoxide (Co) and ozone (O3), primarily originating from industrial emissions, vehicle exhaust, and biomass burning [3,4]. Seasonal studies reveal significant variations in pollutant concentrations, with PM2.5 levels peaking in the winter due to increased coal burning for heating and meteorological conditions that trap pollutants [5,6].
The advent of satellite technology, especially the Copernicus Sentinel-5P satellite, has significantly advanced global air quality monitoring and analysis. Equipped with the Tropospheric Monitoring Instrument (TROPOMI), Sentinel-5P offers high-resolution data on various atmospheric pollutants, enabling detailed spatial and temporal analysis. Liu, et al. (2019) demonstrated Sentinel-5P's effectiveness in capturing spatial-temporal variations of ambient air pollutants across China, identifying pollution hotspots, and tracking pollution transport. Similarly, Zhang, et al. (2020) used Sentinel-5P data to analyze NO2 and O3 levels in major Chinese cities, revealing significant seasonal and diurnal variations linked to anthropogenic activities and meteorological conditions. These studies underscore the critical role of satellite data in enhancing our understanding of air quality dynamics and informing effective air quality management policies [1,3].
In Sichuan Province, previous research primarily relied on ground-based monitoring and limited remote sensing data for evaluating air pollution levels. For example, Huang, et al. (2014) analyzed PM2.5 sources during haze events in Chengdu, highlighting the contributions of secondary aerosols and local emissions. Chen, et al. (2018) investigated long-term ozone trends, attributing variations to local emissions and regional transport influenced by meteorological conditions. However, these studies are often constrained by the spatial and temporal limitations of ground-based observations. Integrating Sentinel-5P data offers a more comprehensive approach to air quality monitoring in Sichuan, overcoming traditional monitoring limitations. Wang, et al. (2019) utilized Sentinel-5P data to examine the spatial distribution of NO2 and CO in Chengdu, identifying significant pollution sources and seasonal trends. This integration underscores the potential of Sentinel-5P data to enhance our understanding of air pollution patterns and support targeted mitigation strategies, representing a significant advancement in addressing Sichuan's air quality challenges and protecting public health [2,4,6].
In Chengdu, the land cover map indicates that urban areas make up roughly 35% of the total land, highlighting notable urban growth. Agricultural land occupies about 30%, continuing to play a vital role in local food production. Forests cover around 20%, predominantly situated in the hilly and mountainous areas. Water bodies, including rivers, lakes, and reservoirs, constitute approximately 5% of the land area. The remaining 10% consists of other land cover types such as grasslands, wetlands, and barren land [1].
The analysis focuses on four key atmospheric pollutants: Carbon Monoxide (CO), Nitrogen Dioxide (NO2), Sulfur Dioxide (SO2), and Ozone (O3). The data for these pollutants is sourced from the Copernicus Sentinel-5P satellite. For each pollutant, a specific function was created to calculate the average monthly concentration. This involved filtering the dataset by date and region, computing the mean concentration for each month, and then clipping the result to fit the study area. This process was repeated for each month from January 2019 to December 2023, resulting in a collection of monthly average images for each pollutant.
Data selection and preprocessing
The Sentinel-5P data was sourced from the Google Earth Engine (GEE) platform, which provides access to preprocessed Level 2 products with global coverage. The study period spanned from January 1, 2019, to December 31, 2023. Data selection criteria included availability, cloud cover, and temporal coverage to ensure robust monthly datasets. Preprocessing steps involved applying a cloud mask to each image, excluding pixels with a cloud fraction greater than 0.3 to mitigate cloud cover impact. Daily data was aggregated into monthly means to reduce noise and enhance the temporal trend analysis. Subsequently, the data was spatially clipped to the geographical boundaries of Sichuan Province using a shapefile to focus the analysis exclusively on the target area.
Data processing and analysis
The statistical analysis comprised several key steps. Monthly average concentrations for each pollutant were calculated using GEE by filtering datasets by date and region, computing the mean concentrations, and clipping the results to fit the study area. A sequence of dates representing the start of each month within the study period was generated. The function for calculating monthly means was applied to this sequence, creating an image collection of monthly average concentrations for each pollutant. The total mean concentration for each pollutant over the entire study period was then calculated by averaging the monthly images, providing a single image that represents the mean concentration of each pollutant from 2019 to 2023.
Seasonal patterns were examined by aggregating monthly data into seasonal averages (winter, spring, summer, and fall) to identify temporal variations. Spatial distribution analysis involved generating maps of the total mean concentrations over the study period by averaging the monthly images, producing single images that represented the mean concentrations of each pollutant from 2019 to 2023. The processed data was then exported from GEE to Google Drive and imported into ArcGIS Pro for further visualization. In ArcGIS Pro, spatial distributions were mapped, and temporal trends were depicted using charts displaying the monthly mean concentrations for each pollutant. Charts depicting the monthly mean concentrations were created to visualize temporal trends for each pollutant. Additionally, maps showing the total mean concentrations over the study period were developed to highlight spatial patterns. These visualizations, produced using ArcGIS Pro, enhance the clarity and impact of the results, facilitating a more detailed and accessible presentation of the findings.
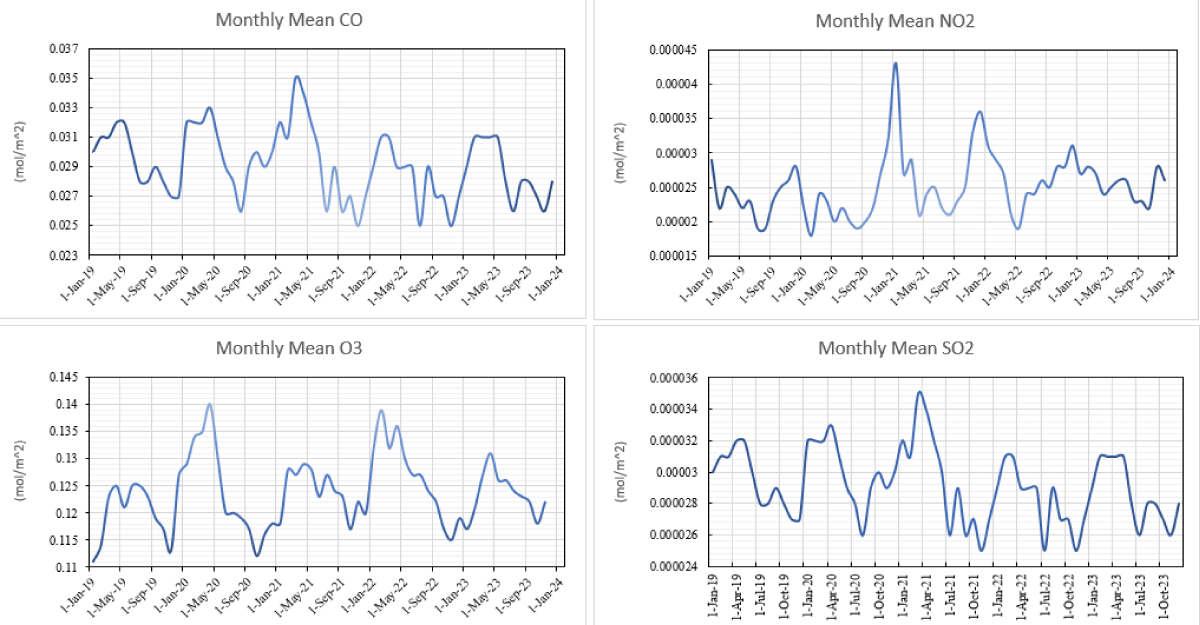
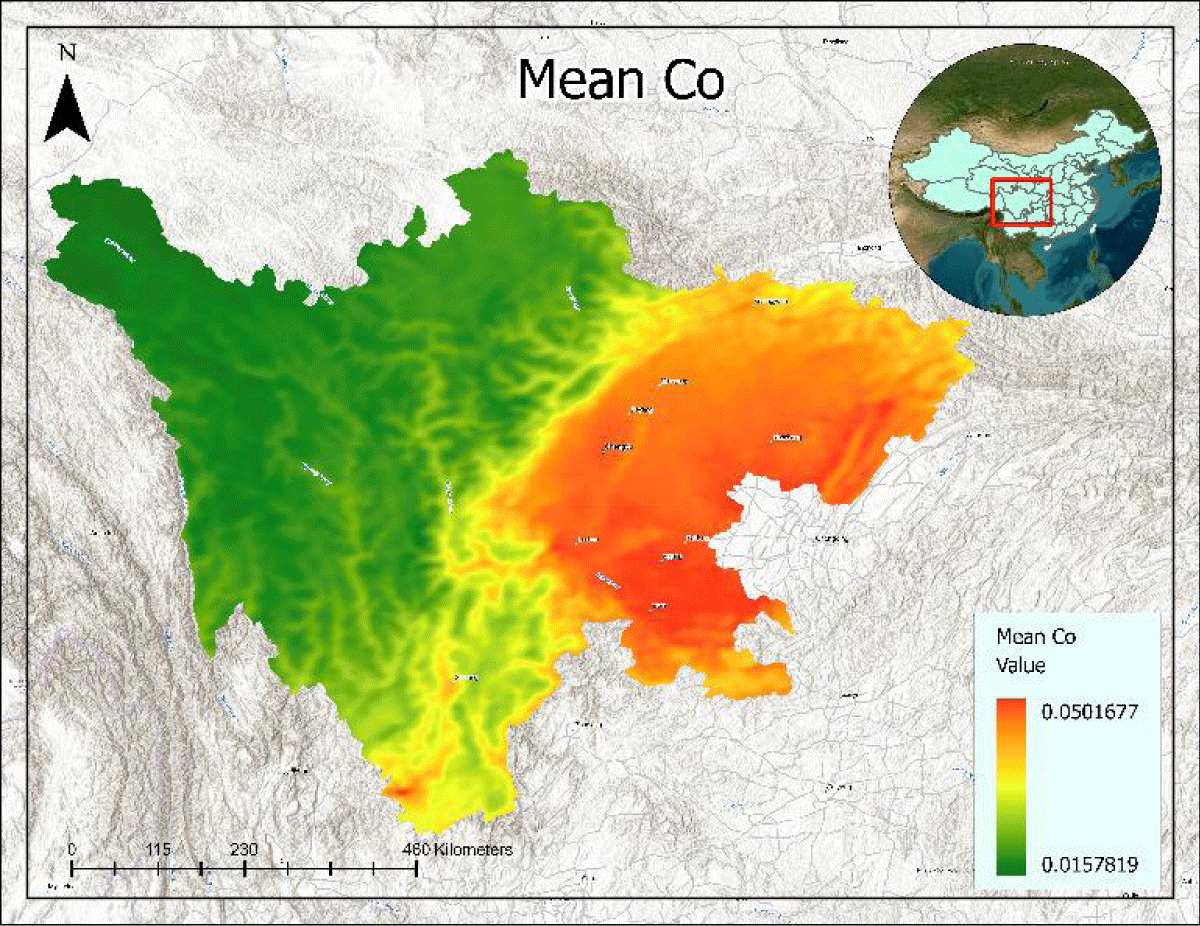
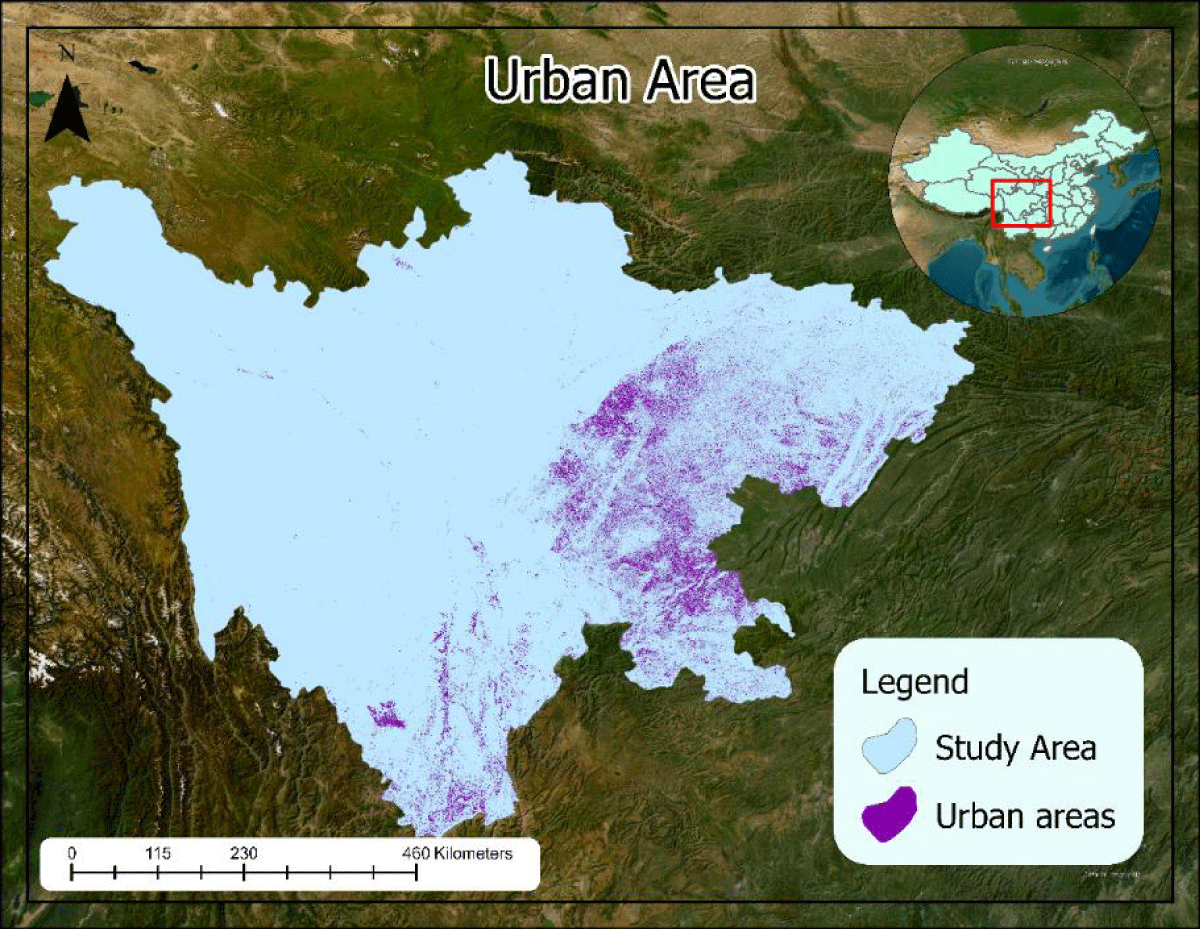
From January 2019 to December 2023, we observed carbon monoxide (CO) levels ranging from 0.025 to 0.035 mg/m³, with most readings clustered between 0.028 and 0.032 mg/m³, as shown in Figure 1. The data shows a clear seasonal pattern, with higher CO levels in winter and lower levels in summer. There were some notable spikes in 2021, but recent years have generally shown more stable and lower levels. Urban areas often experience higher CO levels, likely due to industrial activities and traffic, as illustrated in Figure 2. In contrast, rural areas typically have lower CO levels. When. This means that, according to the latest WHO standards, the CO levels observed are much higher than what is considered safe. Therefore, it’s crucial to continue monitoring these levels, particularly in urban areas as shown in Figure 3 where they tend to be higher. These findings underscore how seasonal changes and urban factors affect CO levels and highlight the need for further investigation to understand the underlying causes and impacts better.
Figure 1: The Monthly Mean Value for CO, NO2, O3 and SO2.
Figure 2: The mean CO from 2019 to 2023.
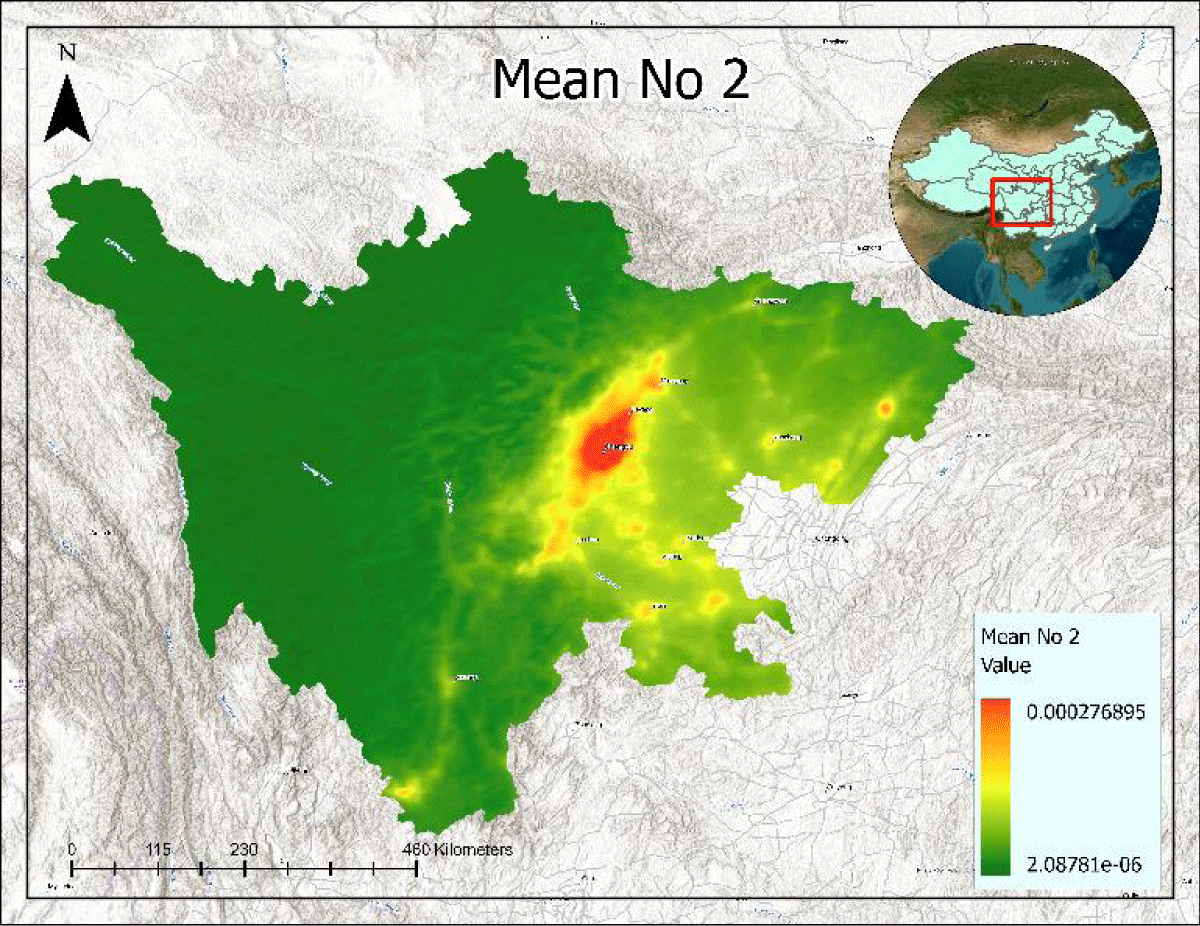
From January 2019 to December 2023, the average nitrogen dioxide (NO2) levels ranged between 0.000018 and 0.000043 g/m³, as shown in Figure 1. Most values were clustered between 0.000022 and 0.000031 g/m³. The data reveals noticeable fluctuations, with peaks reaching 0.000043 g/m³ in early 2021 and lows of 0.000018 g/m³ in early 2020. Seasonal patterns are clear, with NO2 levels typically higher in the winter and lower in the summer, likely due to variations in heating and traffic. Urban areas often record elevated NO2 levels, as shown in Figure 4, reflecting increased pollution from traffic and industrial sources. Recent years (2022-2023) indicate a trend towards more moderate NO2 levels, with fewer extreme values, although some fluctuations persist. When compared to the updated WHO guidelines, the highest monthly value recorded (0.000043 g/m³) is above the annual mean limit of 0.000010 g/m³. This suggests that NO2 levels are significantly higher than what is considered safe according to the latest WHO standards. All monthly values are still well below the hourly mean guideline of 0.000200 g/m³.
Figure 3: Urban Area.
Figure 4: The mean NO2 from 2019 to 2023.
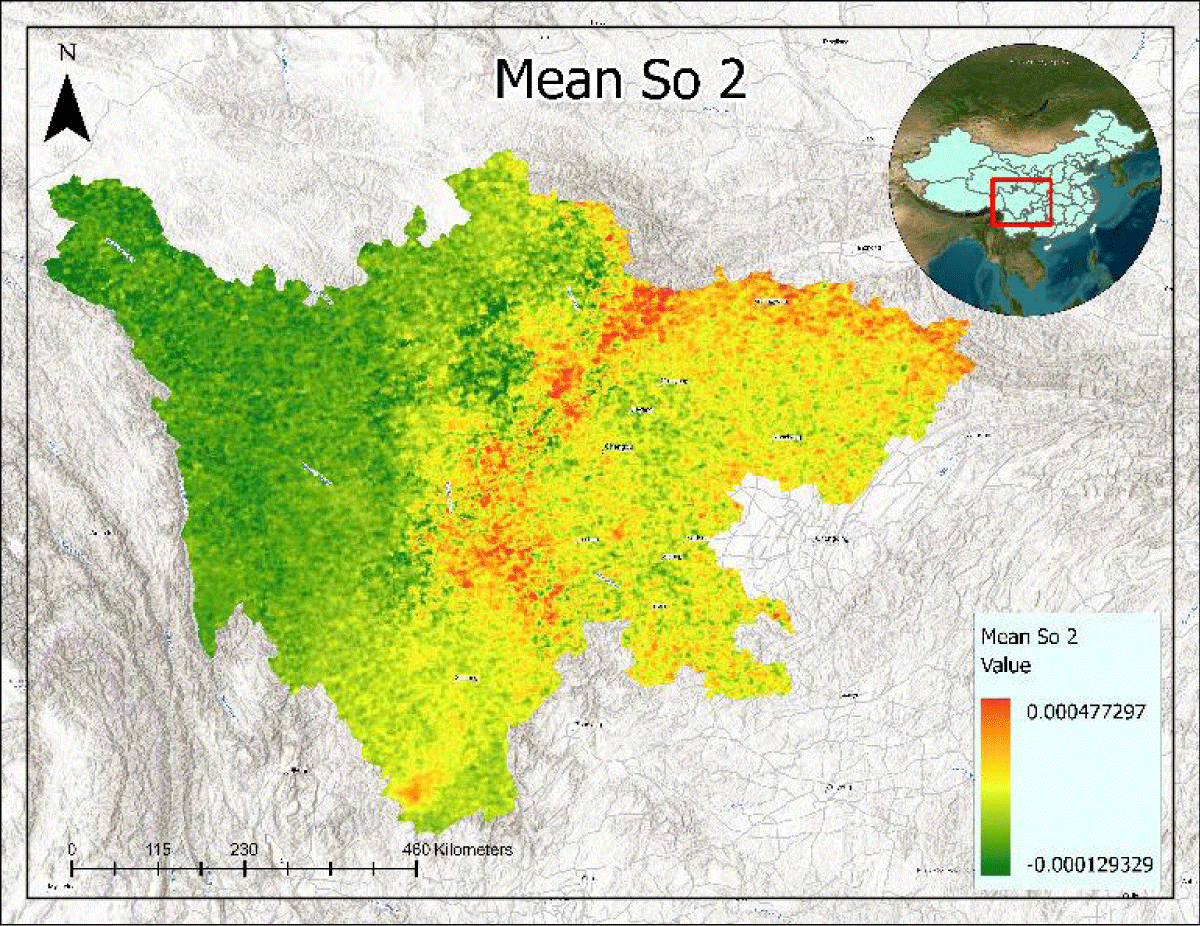
These findings underscore the impact of seasonal and urban factors on NO2 levels and highlight the importance of ongoing monitoring to effectively manage air quality. From January 2019 to December 2023, sulfur dioxide (SO2) levels were observed to range from 0.000025 to 0.000035 g/m³, as depicted in Figure 1. The majority of these values clustered around 0.000028 to 0.000032 g/m³. Seasonal variations were prominent, with higher SO2 concentrations typically recorded during the winter months and lower concentrations during the summer. Notably, peak levels reached up to 0.000035 g/m³ in early 2021, while the lowest values were recorded at 0.000025 g/m³ in mid-2022. Urban areas consistently showed higher SO2 levels, as shown in Figure 5, which can be attributed to increased pollution from industrial activities and vehicular emissions. In contrast, rural areas exhibited lower SO2 levels.
Figure 5: The mean SO2 from 2019 to 2023.
When comparing these findings with the updated WHO guidelines, the highest monthly SO2 value recorded (0.000035 g/m³) is significantly below the WHO’s 24-hour average guideline of 0.040 mg/m³ (0.040 g/m³) and the annual mean guideline of 0.010 mg/m³ (0.010 g/m³). This indicates that while the SO2 levels are generally within safe limits as per WHO standards, continuous monitoring is crucial, especially in urban environments where elevated levels are more prevalent. These findings highlight the significant impact of seasonal and urban factors on SO2 concentrations and emphasize the necessity for ongoing surveillance to effectively manage and ensure air quality.
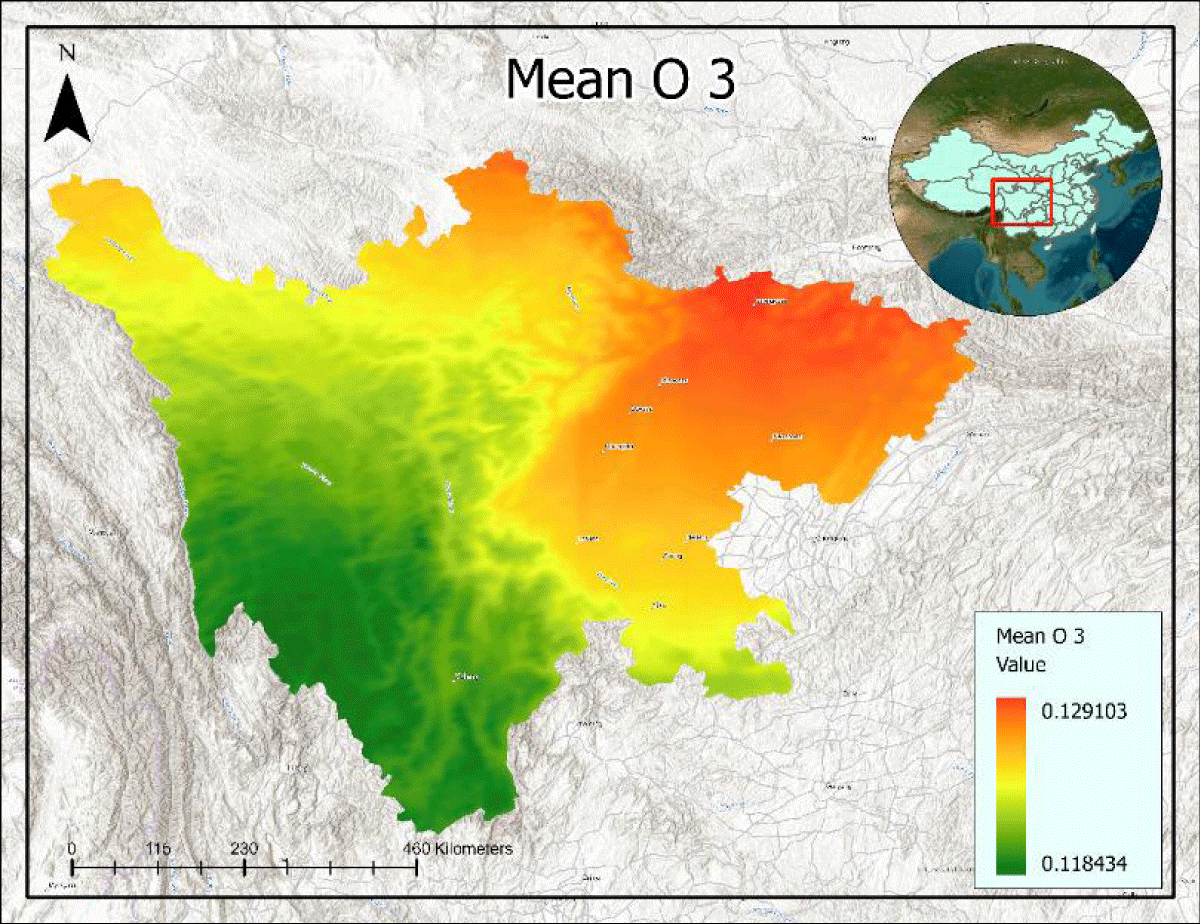
From January 2019 to December 2023, ozone (O3) levels ranged from 0.111 to 0.140 g/m³, with most values clustering between 0.120 and 0.130 g/m³. Seasonal patterns were evident, with higher O3 levels typically observed in the spring and summer months, likely due to increased sunlight and higher temperatures that facilitate ozone formation. For instance, the highest value, 0.140 g/m³, was recorded in April 2020, while the lowest value, 0.111 g/m³, occurred in January 2019. Elevated O3 levels were often found in urban areas as shown in Figure 6, likely due to increased traffic and industrial activities that release precursor pollutants. In contrast, rural areas generally had lower O3 levels. Comparing these values with the updated WHO guidelines, the highest recorded monthly value (0.140 g/m³) exceeded the WHO’s recommended 8-hour average limit of 0.060 mg/m³ (0.060 g/m³). This indicates that while O3 levels are usually within safe limits, they sometimes surpass the recommended threshold, particularly in urban areas. These findings highlight the significant influence of seasonal and urban factors on O3 levels, emphasizing the need for ongoing monitoring and mitigation strategies to manage air quality effectively.
Figure 6: The mean O3 value from 2019 to2023.
This study reveals significant seasonal and urban variations in air pollutants in Sichuan Province, consistent with findings from recent studies globally. The elevated levels of Carbon Monoxide (CO) during winter in Sichuan align with similar trends observed in Beijing and Delhi, where winter peaks are attributed to heating and industrial emissions [7,8]. Nitrogen Dioxide (NO2) levels in Sichuan also increase during the winter, echoing patterns seen in Shanghai and various U.S. cities, where traffic and heating contribute to higher NO2 concentrations [9,10]. For Sulfur Dioxide (SO2), winter peaks in Sichuan are comparable to observations in northern China and Mexico City, where industrial activities and coal burning are significant sources [11,12]. Ozone (O3) levels in Sichuan are higher in spring and summer, reflecting trends in cities like Los Angeles and Sydney, where elevated temperatures and sunlight enhance ozone formation [13,14]. These findings underscore the impact of seasonal and urban factors on air quality and highlight the importance of targeted monitoring and mitigation strategies.
This study explored air pollution in Sichuan Province, China, from January 2019 to December 2023 using data from the Copernicus Sentinel-5P satellite. It revealed that levels of CO, NO2, SO2, and O3 varied with the seasons, with urban areas facing higher pollution due to industrial and vehicle emissions. CO and O3 levels often surpassed WHO guidelines, especially in winter and summer, posing health risks. While many pollutant levels were generally within safe limits, ongoing monitoring, and targeted actions are crucial to improving air quality and safeguarding public health in urban areas.
The study also highlights significant differences in air pollution levels between urban and rural areas. Urban areas exhibit markedly higher concentrations of CO, NO2, SO2, and O3 compared to rural regions, primarily due to industrial activities, vehicular emissions, and dense human activities. These findings are consistent with patterns observed in other major cities globally, such as Beijing, Delhi, Shanghai, Los Angeles, and Mexico City. For instance, CO levels in urban areas reflect similar trends observed in Beijing and Delhi, while NO2 concentrations align with findings from Shanghai and Los Angeles. SO2 levels in urban areas are higher due to industrial processes and coal burning, a trend mirrored in northern China and Mexico City. O3 levels are elevated in urban areas during warmer months, resembling patterns seen in Sydney and Los Angeles. Despite these insights, the study has limitations. The reliance on satellite data may not capture localized pollution sources and variations within urban areas. Ground-based measurements could provide a more detailed understanding of specific sources. Additionally, cloud cover and atmospheric conditions may affect satellite data accuracy, leading to potential inconsistencies. The study also does not account for socioeconomic factors that could influence pollution levels and health outcomes.
Future research should integrate ground-based air quality measurements with satellite data for improved accuracy. Exploring socioeconomic factors, expanding to other regions and pollutants, and utilizing higher-resolution satellite data would enhance the understanding of air pollution dynamics. Additionally, evaluating the effectiveness of various mitigation strategies in both urban and rural settings could contribute to developing comprehensive air quality management plans. Addressing these areas will provide a more detailed and accurate picture of air pollution, leading to more effective strategies for managing and mitigating air quality issues.
- Liu Y, Cui Y, Li F. Spatial-temporal variations and health risks of ambient air pollutants in China during 2014–2017. Sci Total Environ. 2019;655:673-82.
- Huang RJ, Zhang Y, Bozzetti C, Ho KF, Cao JJ, Han Y, et al. High secondary aerosol contribution to particulate pollution during haze events in China. Nature. 2014;514(7521):218-222. Available from: https://doi.org/10.1038/nature13774
- Zhang R, Jing J, Tao J, Hsu SC, Wang G, Cao J. Chemical characterization and source apportionment of PM2.5 in Beijing: seasonal perspective. Atmos Chem Phys. 2013;13(14):7053-7074. Available from: https://doi.org/10.5194/acp-13-7053-2013
- Chen Z, Zhuang Y, Xie X, Chen D, Cheng N, Wang X. Understanding long-term variations of meteorological influences on ground ozone concentrations in Beijing during 2006-2016. Environ Pollut. 2018;234:861-869.
- Li K, Chen L, Ying F, White SJ, Jang C, Gao X. Meteorological and chemical impacts on ozone formation: A case study in Hangzhou, China. Atmos Res. 2018;214:109-118.
- Wang Y, Ying Q, Hu J, Zhang H. Spatial and temporal variations of six criteria air pollutants in 31 provincial capital cities in China during 2013–2018. Environ Int. 2019;126:171-183.
- Liu Y, Zhang J, Li H. Seasonal variations of carbon monoxide in urban areas of Beijing: Implications for air quality management. Atmos Environ. 2022;261:118549. Available from:
- Gupta R, Singh P, Kumar A. Wintertime carbon monoxide levels and their sources in Delhi: A comprehensive analysis. Environ Sci Pollut Res. 2023;30(10):25432-25446.
- Chen J, Zhang X, Li Q. Seasonal trends and source identification of nitrogen dioxide in Shanghai. Sci Total Environ. 2021;788:147807.
- Adams M, Miller J, Hayes S. Nitrogen dioxide variability in major U.S. cities: A comparative analysis. J Environ Manage. 2022;317:115638.
- Zhang L, Wang Z, Liu Q. High sulfur dioxide concentrations during winter in industrial cities of northern China. Environ Pollut. 2023;314:120260.
- Rodríguez A, Hernández J, Martínez E. Seasonal variations of sulfur dioxide in Mexico City: Implications for urban air quality. Atmos Chem Phys. 2022;22(5):3431-3442.
- Wang S, Zhang Y, Yang L. Summer ozone dynamics in Los Angeles: Insights from satellite and ground-based observations. Environ Sci Technol. 2023;57(7):2945-2956.
- Johnson M, Lee C, Chen S. Understanding summer ozone levels in Sydney: Contributions of meteorological and anthropogenic factors. Int J Environ Res Public Health. 2023;20(4):1982.
